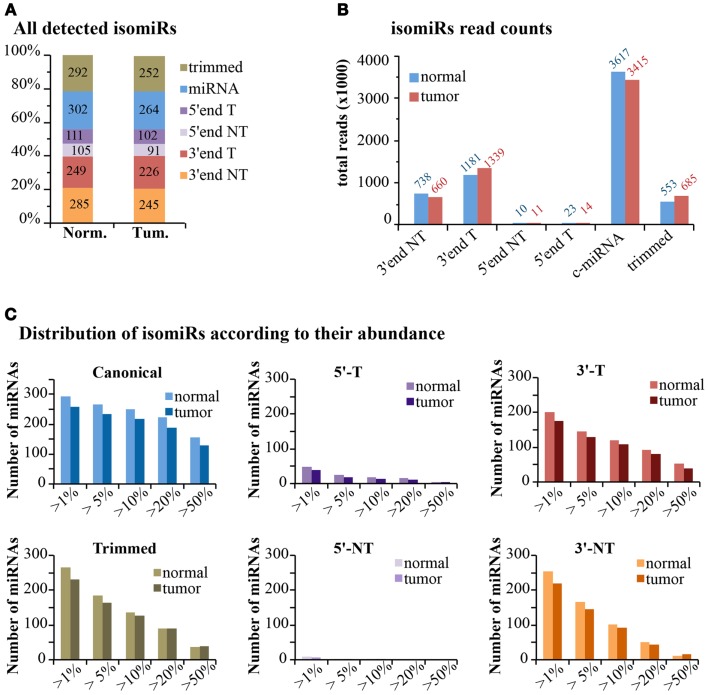
Figure 7.
IsomiRs distribution at genome-wide level. (A) The bar graph shows the percentage of detected IsomiRs (>1 read counts) in the normal and tumor samples, divided in classes, as in Figure 6 (T, templated; NT, non-templated). The absolute number of species is also reported within the bar. (B) Bar graph shows the expression levels (total reads) of the each class. (C) Those miRNAs robustly detected (total read count for all isoforms >100 reads) were selected. Within each miRNA species, we calculated whether the selected isoform type contributes for at least a given percentage over the total reads of each miRNA.

