
Figure 2.
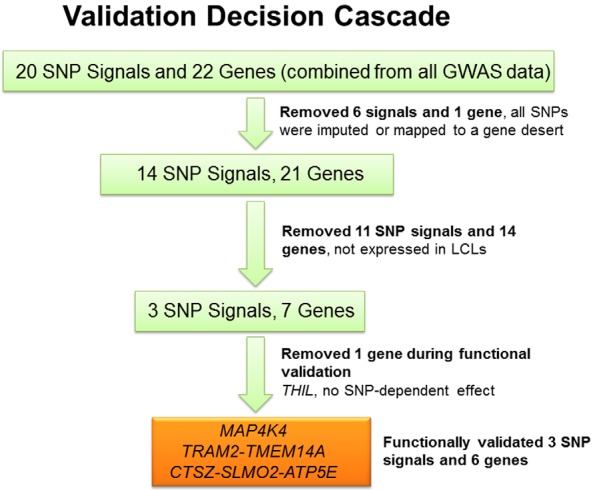
Validation decision cascade used to test GWAS signals. The association analysis shown graphically in the Manhattan plot in Figure 1A resulted in the identification of 20 SNP signals with P < 5E-06. The figure depicts graphically the process for SNP signal and associated gene functional validation.