
Figure 4.
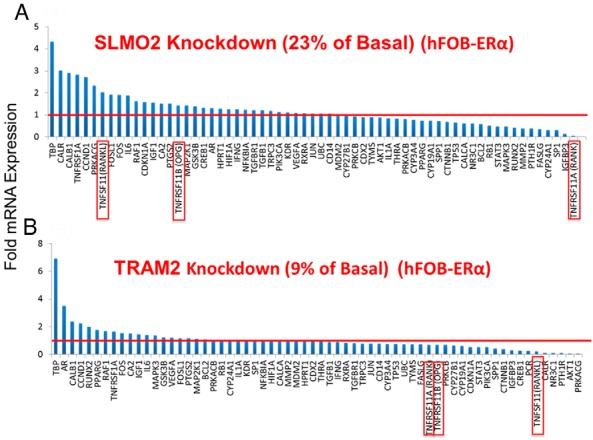
Effect of knockdown of SLMO2 (A) and TRAM2 (B) on the relative mRNA expression of genes involved in the osteoporosis genes primer panel in hFOB-ERα cells. Red lines represent basal control levels of expression. Data for the RANK-RANKL-OPG genes are highlighted with red rectangles.