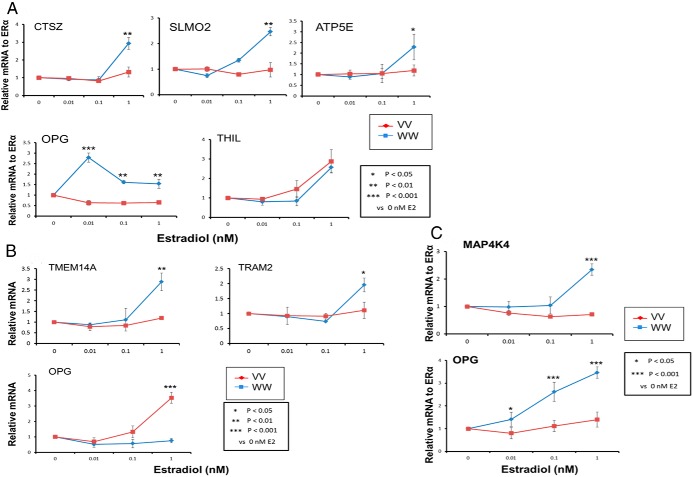
Figure 5.
LCL SNP-dependent variation of candidate gene expression in response to increasing concentrations of E2 for 3 homozygous W/W (blue lines) and 3 homozygous V/V (pink lines) LCLs. A, Relative CTSZ, SLMO2, and ATP5E mRNA expression (upper panels) and relative mRNA expression for OPG and THIL (lower panels). B, SNP-dependent variation in TMEM14A-TRAM2 expression in response to increasing concentrations of E2 for 3 homozygous W/W (blue lines) and 3 homozygous V/V (pink lines) LCLs (upper panels) and relative mRNA expression level for OPG (lower left panel). C, SNP-dependent variation in MAP4K4 expression in response to increasing concentrations of E2 for 3 homozygous W/W (blue lines) and 3 homozygous V/V (pink lines) AA LCLs (upper panel) and relative mRNA expression level for OPG (lower panel). *, P < .05 and **, P < .01 when compared with the alternative genotype at the same concentration of E2.

