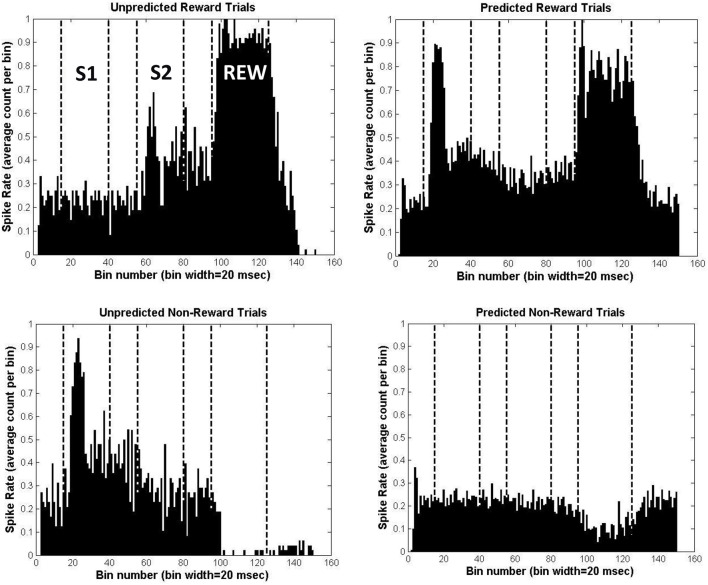
Figure 5.
Simulation results for the Potts associative reward learning task, for a simulated individual with all parameters set to their mean values. Each panel shows the average spike firing rate for simulated midbrain DA neurons across a trial in the task, divided into 20 ms bins. In the upper left panel are the results averaged across the 48 unpredicted reward (UR) trials; in the lower left panel are the result averaged across the 48 unpredicted non-reward (UNR) trials; in the upper right panel are the results averaged across the 196 predicted reward (PR) trials; and in the lower right panel are the results averaged across the 196 predicted non-reward (PNR) trials.

