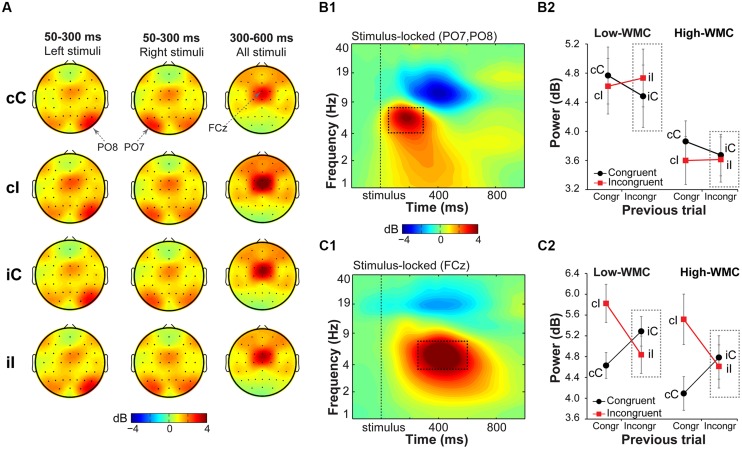
FIGURE 5.
Task-related changes in theta power. (A) Topographical maps of power in the theta band (4–8 Hz) averaged over early (50–300 ms) and late (300–600 ms) intervals, separated for previous and current trial type (lowercase and uppercase letters, respectively). Left- and right-hemifield stimulus trials are shown separately to emphasize laterality effects observed over parietal electrodes. (B1) Condition-averaged changes in power relative to the baseline (-300 to –100 ms) period over parietal electrodes contralateral to stimulus presentation hemifield (averaged PO8 and PO7); (C1) and over medial frontal electrode FCz. Dashed squares represent the time-frequency windows used for the ANOVAs. Condition-specific changes in theta power over parietal (B2) and medial frontal areas (C2) as a function of previous and current trial type, and WMC group. Dashed squares represent conditions used for WMC-related analyses.

