FIGURE 6.
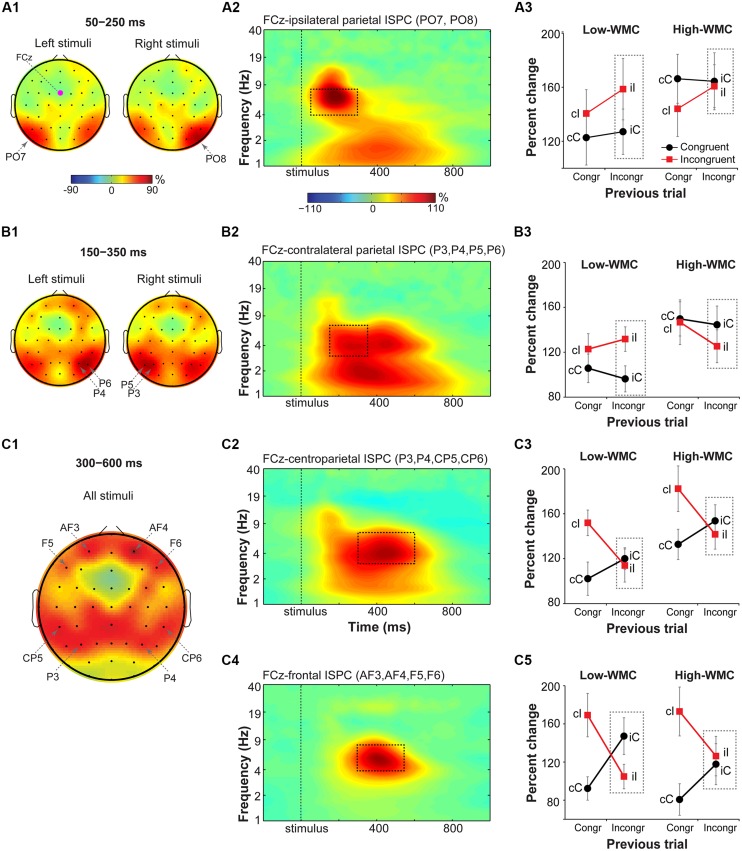
Task-related changes in theta inter-site phase clustering. Topographical maps of FCz-seeded ISPC in: (A1) early (50–250 ms), (B1) later (150–350 ms), and (C1) late (300–600 ms) time windows. (A2,B2,C2,C4) Condition- and participant-average time-frequency representation of ISPC between FCz (the “seed”) and stimulus-ipsilateral parietal sites (PO7, PO8), stimulus-contralateral parietal sites (P3, P4, P5, P6), bilateral parietal sites (P3, P4, CP5, CP6), and frontal sites (AF3, AF4, F5, and F6). Dashed squares represent the time-frequency windows used for the ANOVAs. (A3,B3,C3,C5) Condition-specific changes in theta-band ISPC as a function of previous and current trial type, and WMC group. Dashed squares represent conditions used for WMC-related analyses.

