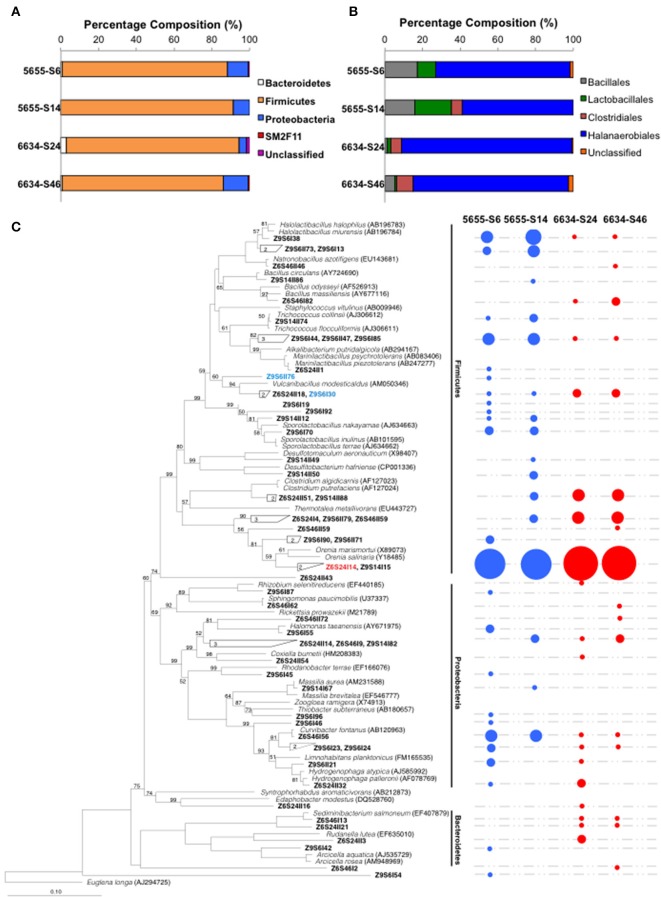
Figure 3.
Microbial composition (A), the dominant Firmicutes phylum (B) and phylogenetic tree (C) of the microbial communities inhabiting in the formation water collected from 1.72 to 2.02 km in depth of the IBDP verification well VW1. The values n and n' listed on the top of the figures (A,B) indicate number of 16S rRNA used for analyses. Both the intermediate and final samples are included in this analysis. The IDs in bold fond in (C) indicate the OTUs of the microbial communities identified using 97% as the cutoff value. The OTUs belonging to the same clusters were grouped together and the numbers of grouped OTUs were labeled in the clades. The circles on the right side indicate the presence of detected OTUs and their size is proportional to the fractions of the corresponding OTUs based on the clone library analysis. The species in italic font were type strains selected from RDP database and most closely related to the detected clones. The NCBI accession numbers of the type strains are listed in the parentheses. The scale bar indicates 0.1 changes per nucleotide position. Statistical confidence for the evolutionary tree was assessed by bootstrap (1000 replicates) and shown as bootstrap values in percentage. The organisms that were successfully enriched from IBDP5655 and IBDP6634 are shown in blue and red colors, respectively.

