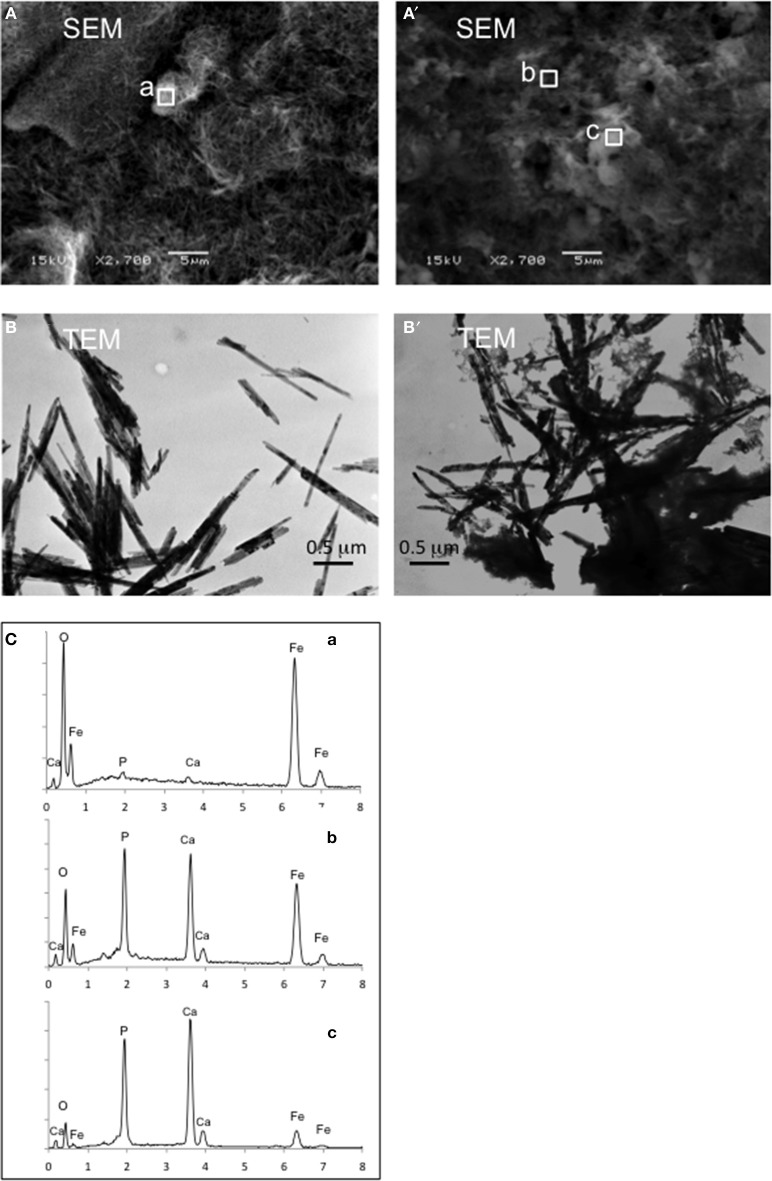
Figure 6.
Mineral morphology and element composition identified by SEM, TEM and SEM-EDX for goethite reduction by IBDP6634. The control samples prepared and incubated under the same condition but without cell inoculation are illustrated as (A,B); (A') and (B') show the mineral after being reduced by IBDP6634. Elemental compositions of the regions a, b, and c are shown in (C).

