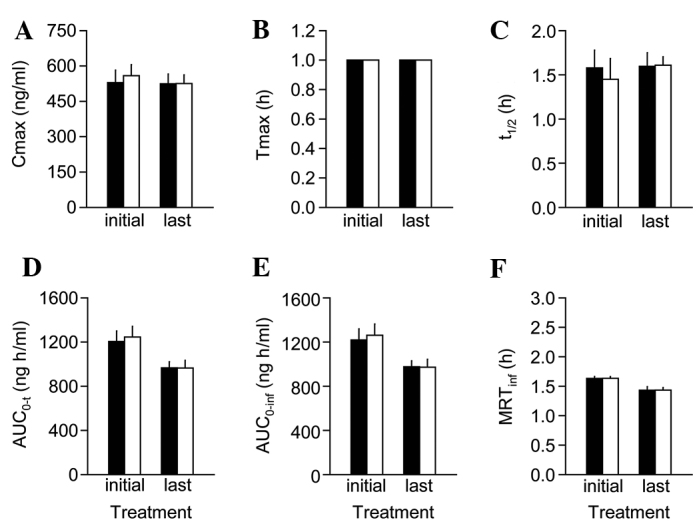
Figure 4.

Pharmacokinetic profiles of perindopril in combination with Chungsinoryungsan at 2-h interval. The plasma samples used in Fig. 3 were subjected to analyses of pharmacokinetic parameters: (A) Peak concentration (Cmax), (B) time to reach the Cmax (Tmax), (C) terminal half-life (t1/2), (D) area under the perindopril concentration-time curve (AUC0-t), (E) AUC zero to infinity (AUC0-inf) and (F) mean residence time to infinity (MRTinf). The corresponding data represent average values ± SEM in the combination group (white bars) and control (black bars) after the initial and last co-administration of repeated dosing for a week.
