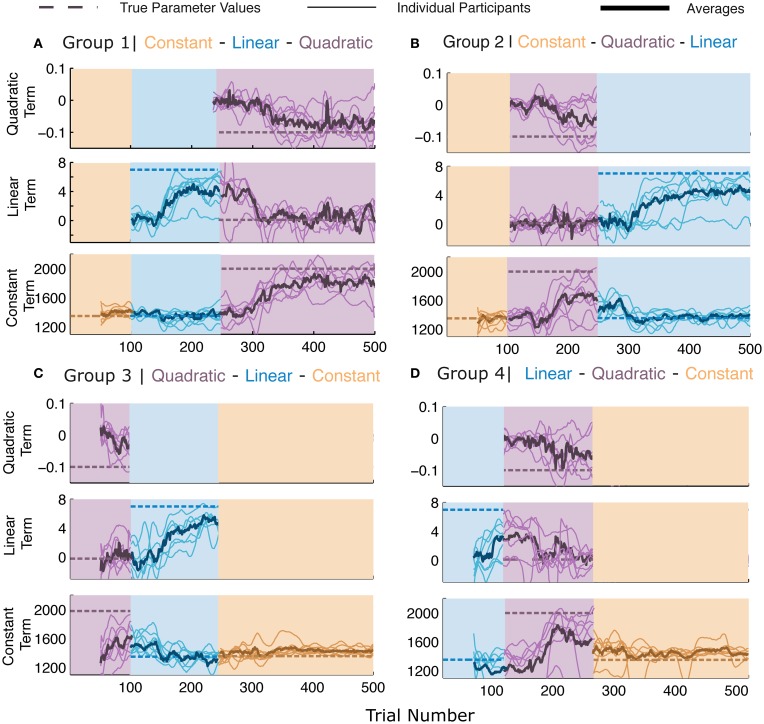
Figure 3.
Parameter learning in Experiment 2. (A–D) The four panels represent the four different groups of participants. Each panel consists of three sub-parts, each indicating the parameters for the terms of the model when the corresponding generating functions were presented (note that the parameters have different scales and dimensions). Dashed lines represent the values of the generating function. All other lines represent the maximum likelihood estimate (MLE) of the parameters in a moving window of 50 trials. Thin lines represent individual participants and thick lines represent averages. The lines pertain to the parameters of the presented generating function and therefore there may be discontinuities in the lines at the switches. All participants' data are plotted irrespective of whether or not the generating function was the best description of the participants' responses.

