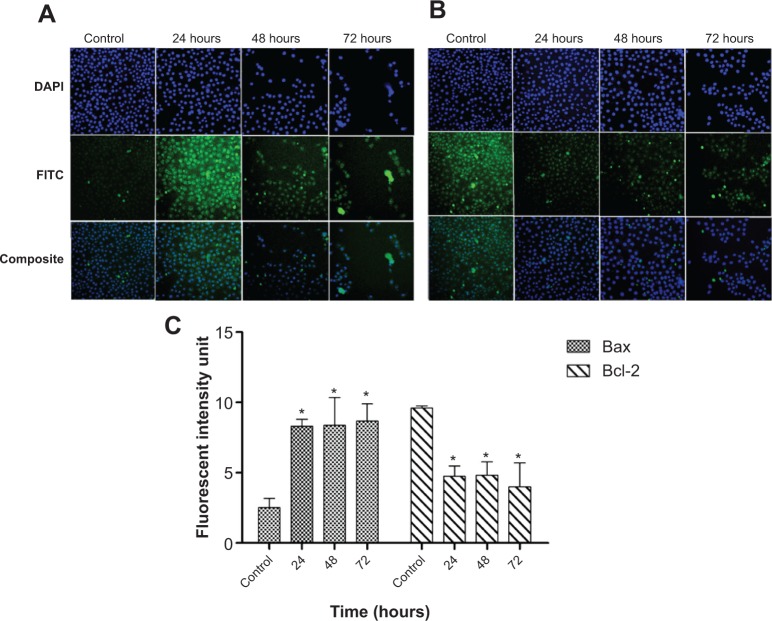
Figure 12.
Immunofluorescence analysis.
Notes: An immunofluorescence analysis of (A) Bax and (B) Bcl-2 in MCF-7 cells depicted a marked elevation in the fluorescent intensity of Bax and reduction in the fluorescent intensity of Bcl-2 antibodies conjugated to FITC, in a time-dependent manner. (C) Quantitative analysis of Bax and Bcl-2 expression in MCF-7 cells showed a time dependent increase in the Bax expression and decrease in the Bcl-2 expression at the protein level. *P<0.05.
Abbreviation: FITC, fluorescein isothiocyanate.

