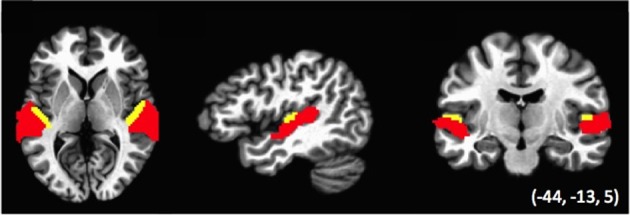
Figure 2.

ROIs used in the Relative similarity analysis (RSA). Areas in red (Auditory cortex ROI) are auditory-functionally defined regions of left and right temporal lobe; areas in yellow (Heschl's gyrus ROI) correspond to the anatomically defined Heschl's gyrus in a standard atlas (see Linke et al., 2011). Note that the two sets of ROIs do not overlap.
