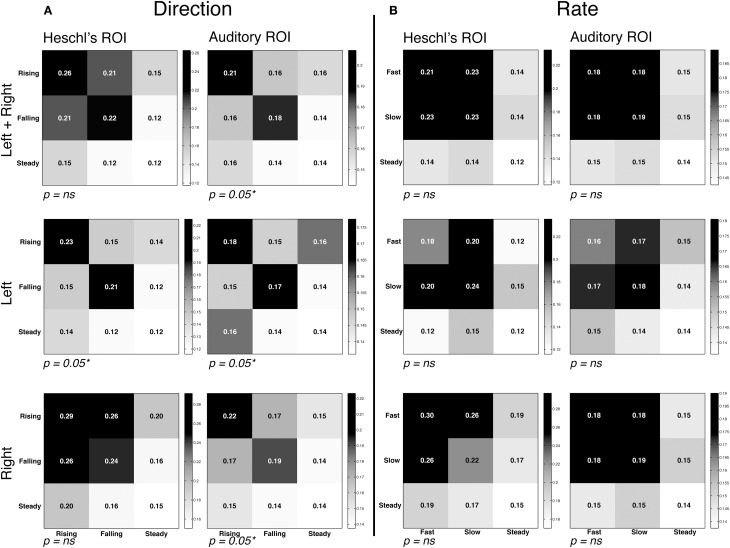
Figure 4.
Representational similarity analysis. Mean correlation of activity patterns between even runs (rows) and odd runs (columns), at each region of interest (see Figure 2). Within-category correlations correspond to the diagonal of the matrix; between-category correlations correspond to off-diagonal values. Higher similarity is depicted by higher correlations and darker shading. Note that overall correlation ranges varied by ROI, and therefore different intensity scales are used in each ROI in order to highlight differences in the relative degree of similarity. Also note that statistical analyses compared the correlation coefficients of cells, and not the significance of each correlation on its own. Thus, P-values correspond to the comparison of between vs. within-condition correlation coefficients for the rapid temporal conditions (the upper left 2 × 2 square of each matrix). In all graphs the third row/column corresponds to the steady state condition. (A) Correlation matrices for the direction contrast, collapsing over the rate manipulation. We observed significantly greater representational similarity within the FM conditions (i.e., rising-rising and falling-falling) compared to between conditions (rising-falling/falling-rising). (B) Correlation matrices for the rate contrast, collapsing over the direction manipulation. No effect of rate was observed, marked by similar degrees of similarity within condition (fast-fast/slow-slow) and between condition (fast-slow/slow-fast).

