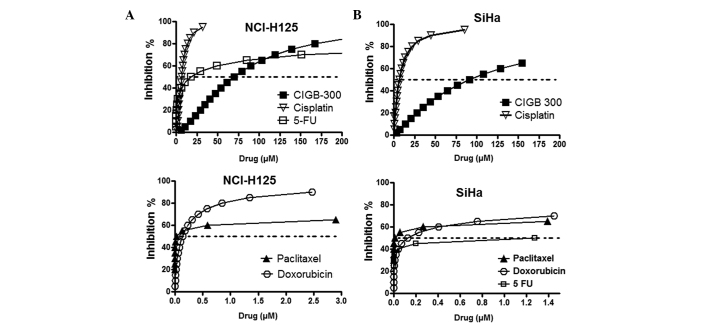
Figure 1.
Antiproliferative dose-response curves for CIGB-300 and chemotherapeutic drugs assessed as single agents in the (A) NCI-H125 lung cancer and (B) SiHa cervical cancer cell lines. The curves were generated by fitting the data derived from the sulforhodamine B-based assays to the median effect equation using the CalcuSyn software. The quality of the fitting was assessed by the r coefficient, where an r>0.9 was obtained for all curves. 5-FU, 5-fluorouracil.

