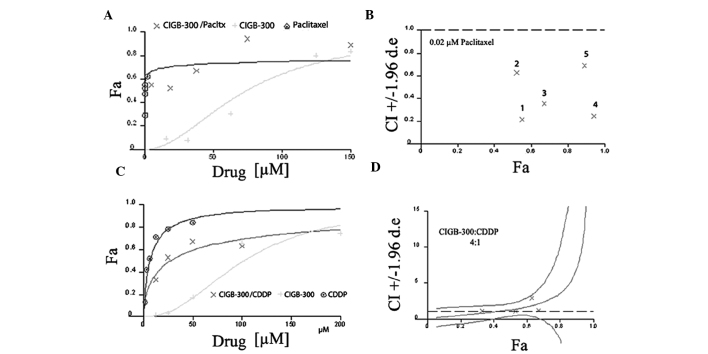
Figure 2.
Graphs generated by the CalcuSyn software using the fraction affected (Fa) vs. concentration data for each drug alone or its combinations in the NCI-H125 (CIGB-300 plus paclitaxel) and SiHa (CIGB-300 plus cisplatin) cell lines. (A and C) Dose-response curves obtained for each drug or its combinations at non-constant ratios using a fixed concentration of paclitaxel (0.02 μM) in NCI-H125 cells (A), or at constant ratios among the drugs (CIGB-300:cisplatin, 4:1) in SiHa cells (C). (B and D) CI vs. Fa graphs for the combinations described in (A and C), respectively. Pacltx, paclitaxel; CDDP, cisplatin; CI, combination index.

