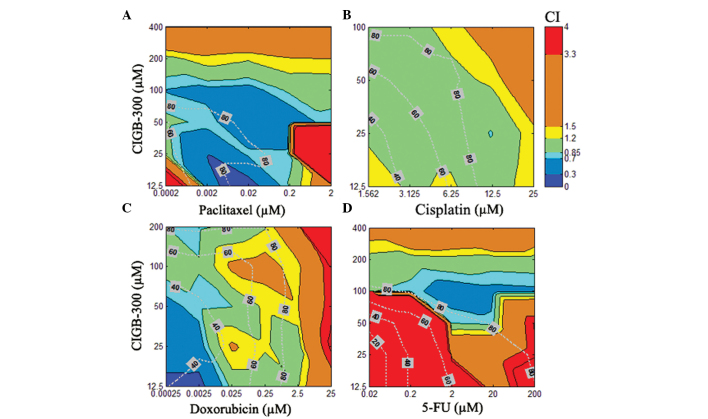
Figure 3.
Interaction surface built using the estimated combination index (CI) for each combination experiment comprising the CIGB-300 peptide and the chemotherapeutic drugs (A) paclitaxel, (B) cisplatin, (C) doxorubicin, or (D) 5-fluorouracil (5-FU) in the SiHa cervical cancer cell line. The CI was calculated with the CalcuSyn software for each particular drug combination and represented in 2D color code graphics or interaction surface. The color code spans from strong synergism (dark blue, CI<0.30) to strong antagonism (red, CI>3.3). The graphics also include the fraction affected (Fa; expressed in %) by each combination across such an interaction surface (dotted line on top). The concentrations of each particular drug in the combinations are denoted on each axis.

