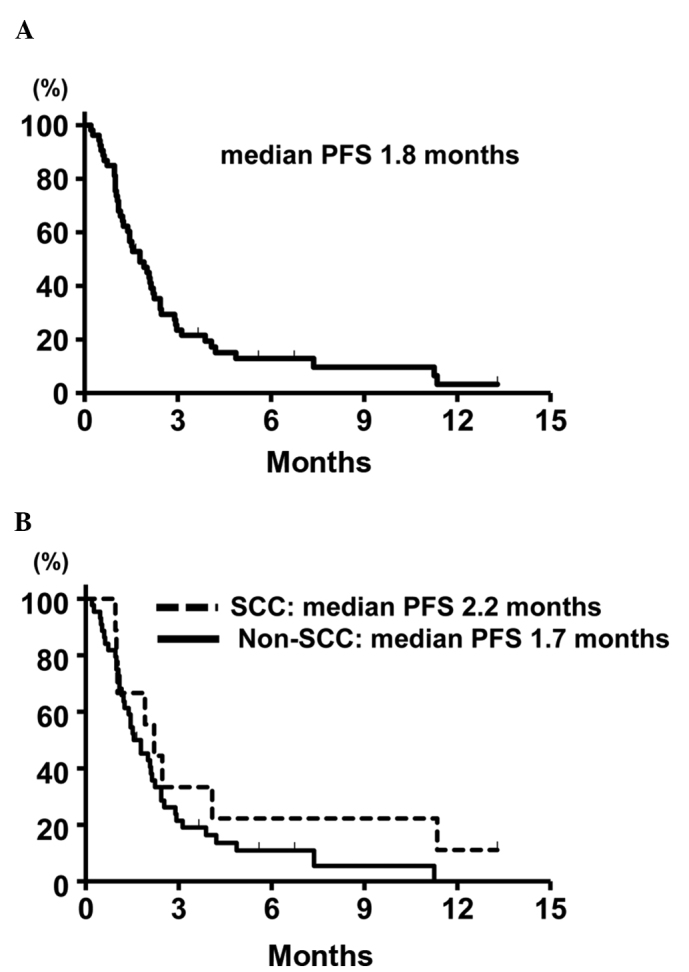
Figure 1.

Kaplan-Meier survival curves for (A) progression-free survival (PFS) in the overall study population (n=53) and (B) progression-free survival in subgroups classified according to histology [squamous cell carcinoma (SCC) (n=9) vs. non-SCC (n=44)].
