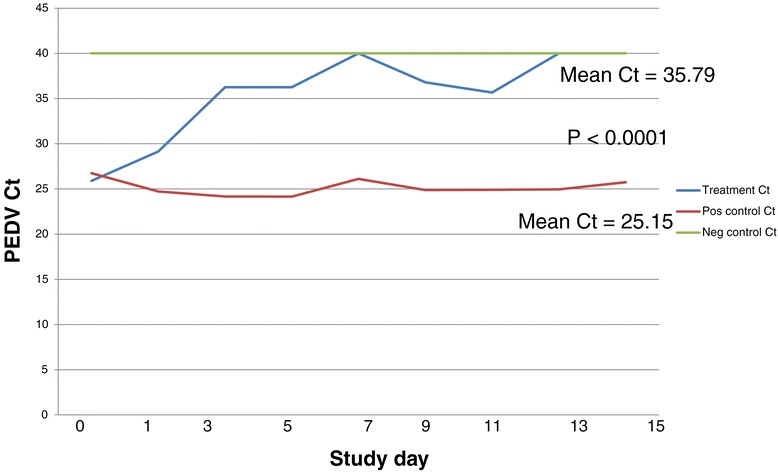
Figure 1.

Change in PEDV Ct levels in feed samples collected across the 3 groups over time. This graph depicts the change over time in Ct values in the feed samples collected from each group of piglets. Note that the initial Ct levels detected in feed samples from both the treatment group and the positive control group were similar in magnitude on day 1; however, while Ct levels in feed fed to positive control piglets remained constant (red line), the levels in feed treated with the liquid antimicrobial product (blue line) demonstrate an increase over the 14 day study period. These data suggest that while viral load remained constant in non-treated feed, it decreased significantly in treated feed. Ct values from the negative control feed (green line) remained PCR negative throughout the study.
