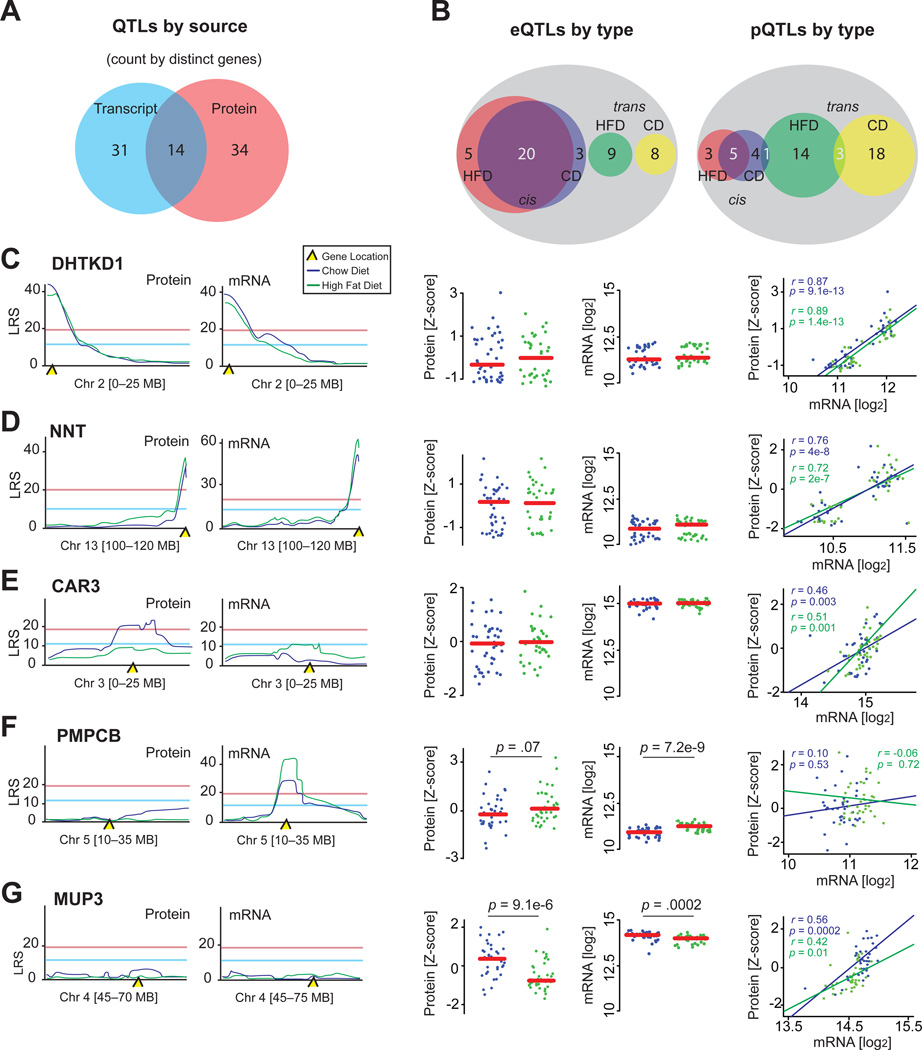
Figure 3. QTL Overview.
(A) Venn diagram separating all genes with distinct QTLs based on provenance.
(B) Venn diagrams separating eQTLs or pQTLs by dietary source and regulatory mechanism. Overlapping regions indicates genes giving an eQTL or pQTL in both diets; white numbers are counted twice for QTL count, but once for distinct gene count (e.g., there are 48 significant cis-eQTLs, which stem from 28 distinct genes).
(C) In both diets, DHTKD1 and Dhtkd1 share a common cis-QTL, are unaffected by diet, and strongly correlate.
(D) NNT and Nnt display a similar pattern.
(E) Car3 has only one significant pQTL despite an absence of dietary effect and a strong transcript-protein correlation.
(F) PMPCB does not map to a significant pQTL; however, Pmpcb maps to a significant cis-eQTL in both diets, despite a strong transcriptional upregulation by HFD. The transcript and protein levels do not correlate.
(G) Mup3 and MUP3 do not map to significant QTLs, despite having high levels of variation and a strong transcript-protein correlation.
Related to Figure S1.

