
Figure 2.
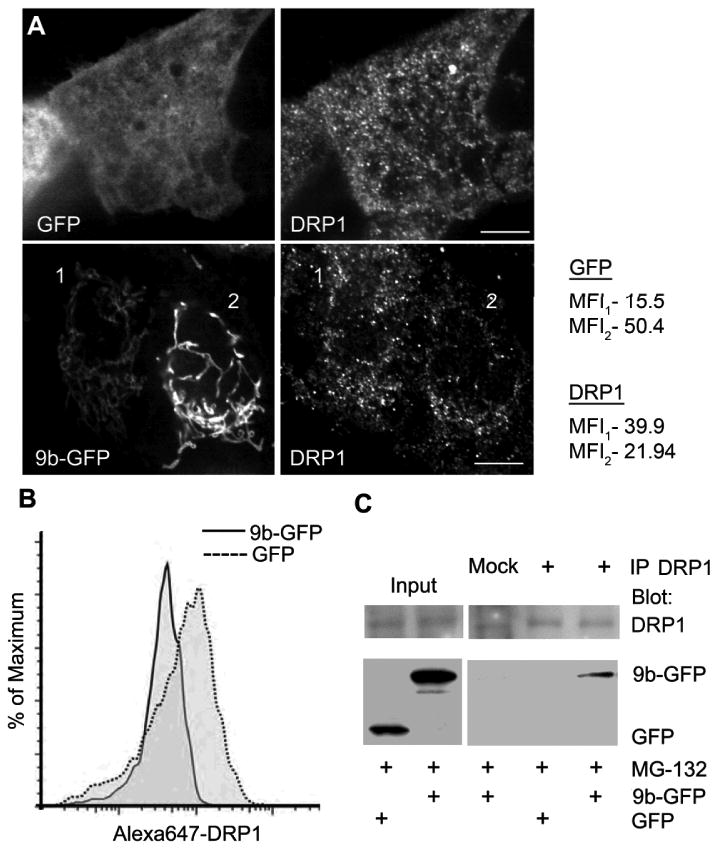
ORF-9b expression leads to less DRP1 associated with mitochondria and ORF-9b co-immunoprecipitates with DRP1. (A) Confocal microscopy of endogenous DRP1 in A549 cells transiently transfected with GFP-ORF9b or GFP vector alone. Scale bar: 10 μm. Mean fluorescence intensity (MFI) of DRP1 or GFP was quantified from the whole volume using ImageJ for cell 1 and cell 2. (B) Flow cytometry analysis of endogenous DRP1 level in A549 cells expressing either GFP or 9b-GFP. The mean fluorescent intensity of DRP1 in GFP+ cells was 186 and 46 in the 9b-GFP+ cells. (C) Immunoblots of DRP1 immunoprecipitates (+) and cell lysates from HEK 293 cells transfected with GFP or 9b-GFP for indicated proteins. Mock is a control antibody immunoprecipitation. Cells were treated with MG-132 (10 μM).