
Figure 7.
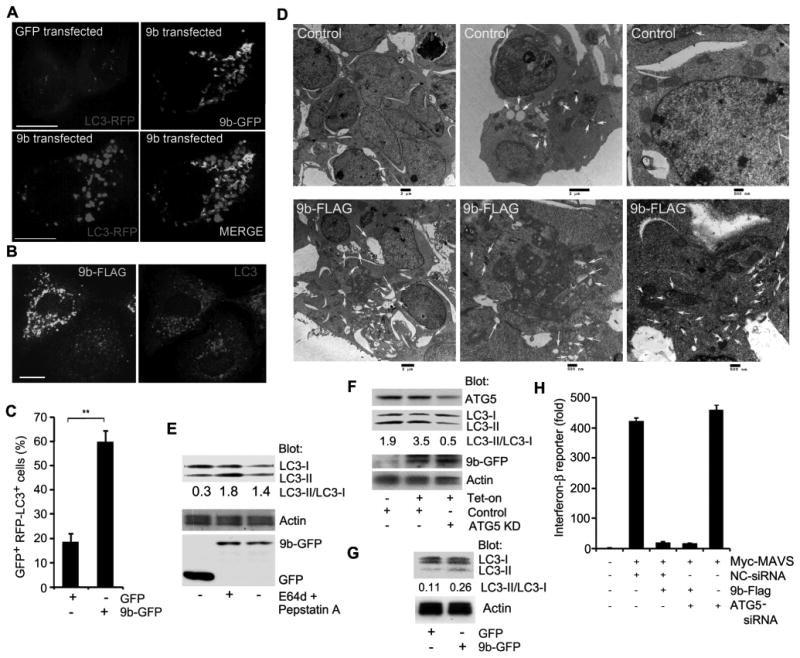
ORF-9b induces autophagy. (A) Images from confocal microscopy of A549 cells co-expressing GFP-vector or 9b-GFP with LC3-RFP. Individual and merged images are shown as indicated. Scale bar: 10 μm. (B) Images from confocal microscopy of A549 cells expressing 9b-Flag and immunostained for endogenous LC3 and Flag. Individual images are shown. Scale bar: 10 μm. (C) The number of GFP positive cells with > 10 LC3-RFP puncta in A549 cells based on the imaging from part A. **p<0.01, t test. (D) Images from electron microscopy of HEK 293 cells expressing a control (top 3 images) or 9b-Flag (bottom 3 images). Scale bars are shown. Arrows mark the autophagosomes. (E) Immunoblot of lysates from A549 cells expressing GFP or 9b-GFP for the indicated proteins. The lysosome inhibitors E64d and pepstatin A were added as indicated for the last 4h. The ratio of LC3-II/LC3-I is shown. (F) Immunoblot of cell lysates from A549 cells expressing 9b-GFP under tetracycline control expressing an ATG5 siRNA or not. The cells were tetracycline-induced for 16 h prior to cell lysis. The ratio of LC3-II/LC3-I is shown. (G) Immunoblot of cell lysates from THP-1 permanently expressing GFP or 9b-GFP. The ratio of LC3-II/LC3-I is shown. (H) IFN-β reporter assay using HEK 293 cells expressing Flag or 9b-Flag along with Myc-MAVS and control or ATG5 siRNAs. Luciferase activity is shown as fold induction.