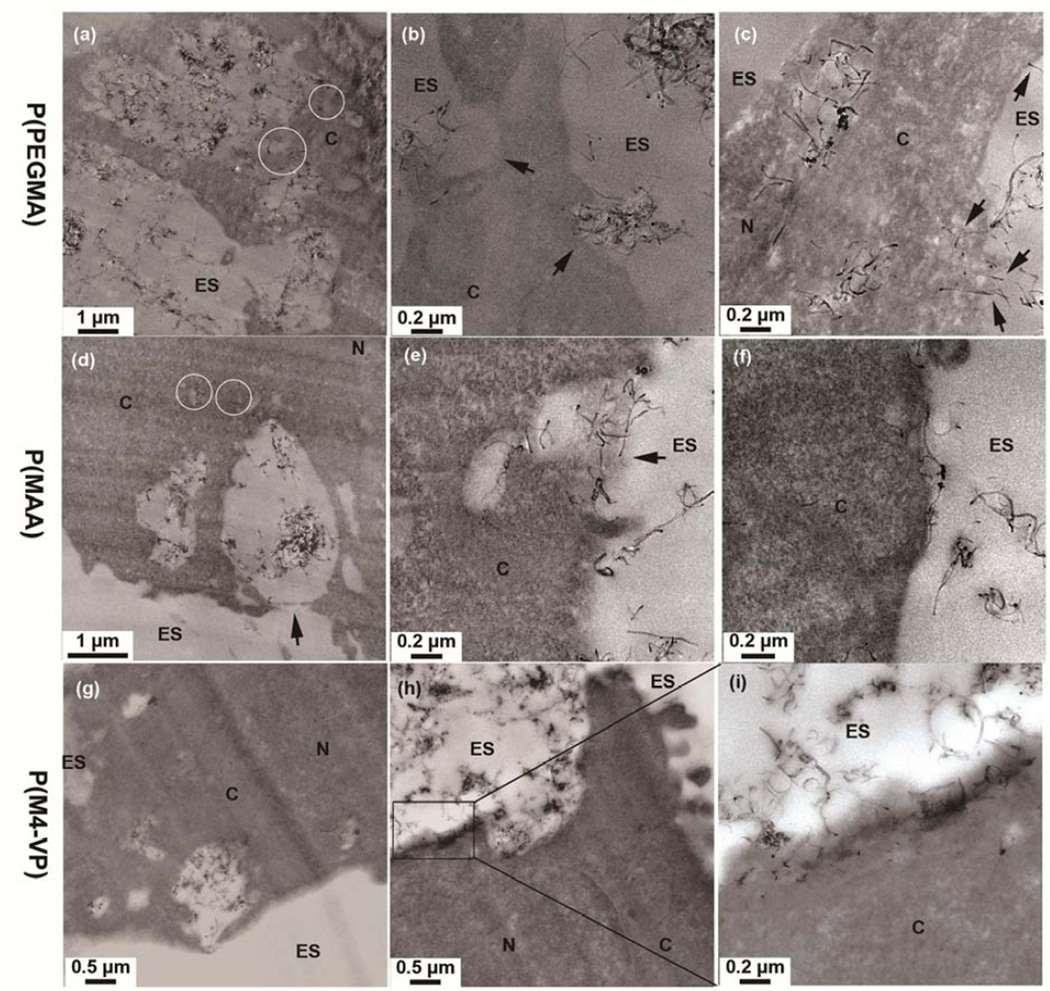
Figure 5.
TEM images showing the cellular distribution and interaction of (a–c) P(PEGMA)-MWNTs, (d–f) P(PMAA)-MWNTs and (g–i) P(M4-VP)-MWNTs with TT1 epithelial cells after 24 hours exposure. Individual MWNTs are indicated by circles. Figure 5i is a higher resolution TEM image of boxed area in Figure 5 h. ES= extracellular space; C=cytoplasm; N=nucleus.

