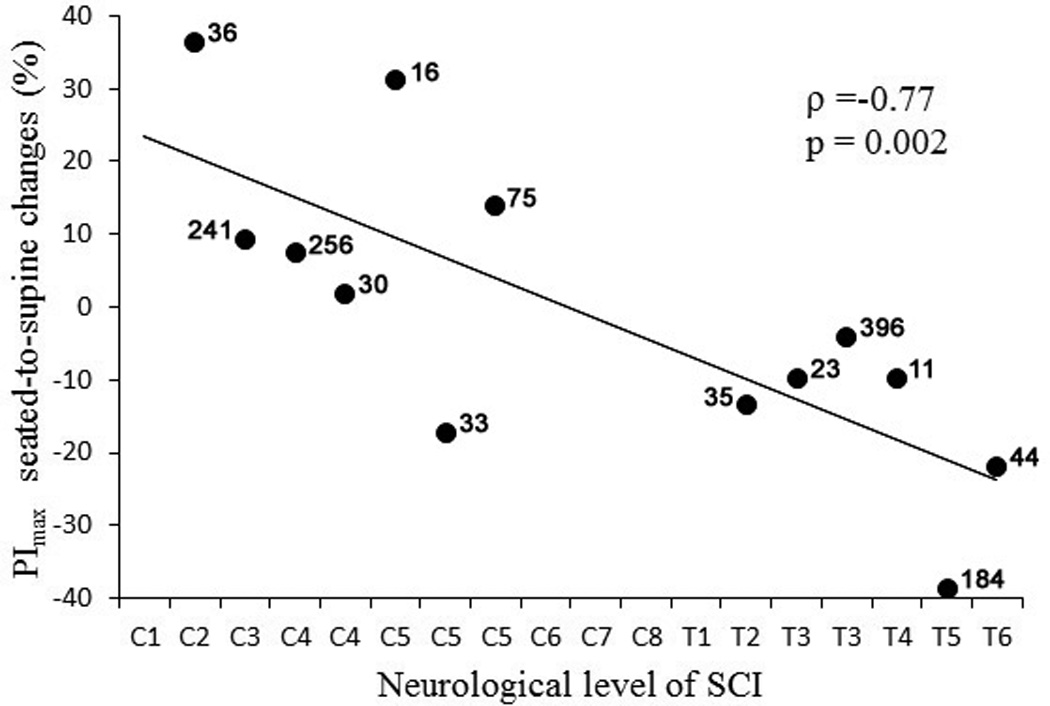
Fig. 1.

Scatter plot of seated-to-supine percent change in PImax values vs. neurological level of injury in participants with both cervical and thoracic motor-complete SCI. The time after injury shown above each individual data point. Note that those with cervical lesions largely had an increase in PImax while subjects with thoracic lesion showed a decrease. Also note that there are no correlation between data points and time after injury.
