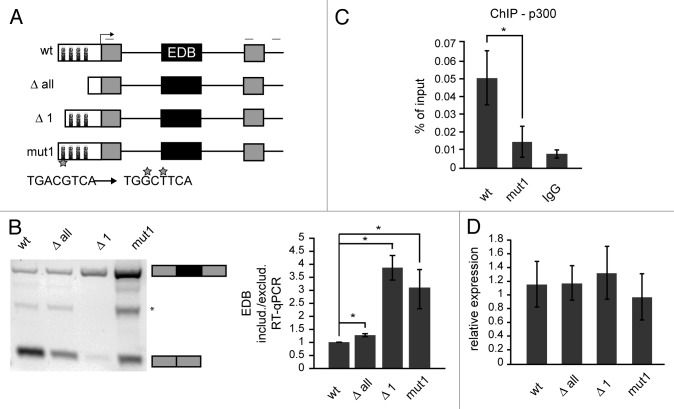
Figure 2. The first CRE site in the promoter influences alternative splicing of the mini-gene reporter. (A) Schematic interpretation of splicing reporters used in this study. White boxes – promoter with CRE sites, gray boxes – constitutive exons, black lines – introns, black box – alternative EDB exon, light gray lines above scheme represent primers used for RT-PCR. The mutated first CRE site and mutated nucleotides are marked by a star. (B) Analysis of splicing pattern of EDB exon after manipulation with CMV promoter by RT-PCR and RT-qPCR (black box – EDB exon, gray boxes – surrounding exons, * marks an unspecific band). The graph shows the ratio of endogenous EDB included or excluded mRNAs originated from individual reporters. The average of three to six experiments (normalized to wt reporter) is shown including SEM, * indicates P ≤ 0.05 of the paired t test with respect to wt reporter. (C) p300 binding to first CRE site analyzed by ChIP. The average of three experiments is shown including SEM, * indicates P ≤ 0.05 of the t test with respect to wt reporter. (D) Relative expression of FN1 cassette from individual reporters was measured by comparing total FN1 reporter mRNA to mRNA of ampicillin resistance gene on same plasmids. The average of three experiments is shown including SEM.

An official website of the United States government
Here's how you know
Official websites use .gov
A
.gov website belongs to an official
government organization in the United States.
Secure .gov websites use HTTPS
A lock (
) or https:// means you've safely
connected to the .gov website. Share sensitive
information only on official, secure websites.
