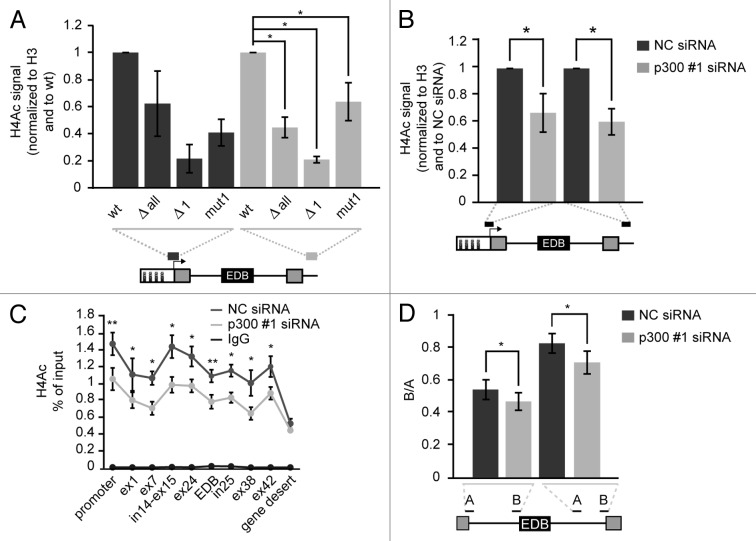
Figure 3. Mutation or deletion of the first CRE site and p300 knockdown reduce H4 acetylation. (A) Native ChIP showing histone H4 acetylation at the promoter and downstream of the FN1 cassette of reporters with different promoters. Grey lines under reporter schemes show primer positions. Nonspecific IgG signal was below 1% of input in all cases. The average of three experiments (normalized to H3 signal and wt reporter) is shown including SEM, * indicates P ≤ 0.05 of the paired t test with respect to wt reporter. (B) Decrease of histone H4 acetylation after p300 knockdown on wt reporter was determined by nChIP. Nonspecific IgG signal was below 1% of input in all cases. The average of four experiments normalized to H3 and NC siRNA treated cells is shown including SEM, * indicates P ≤ 0.05 of the paired t test with respect to NC siRNA treated cells. (C) Significant changes of H4 acetylation along the endogenous FN1 gene after p300 depletion were determined by nChIP. The average of three experiment is shown including SEM, * indicates P ≤ 0.05 and ** indicates P ≤ 0.01 of the paired t test with respect to NC siRNA treated cells. (D) Pol II elongation rate on the FN1 endogenous gene was determined as a ratio of two pre-mRNA sequences (downstream/upstream, B/A) which were positioned within an intron located either upstream or downstream of EDB exon. The average of three experiment is shown including SEM, * indicates P ≤ 0.05 of the paired t test with respect to NC siRNA treated cells.

An official website of the United States government
Here's how you know
Official websites use .gov
A
.gov website belongs to an official
government organization in the United States.
Secure .gov websites use HTTPS
A lock (
) or https:// means you've safely
connected to the .gov website. Share sensitive
information only on official, secure websites.
