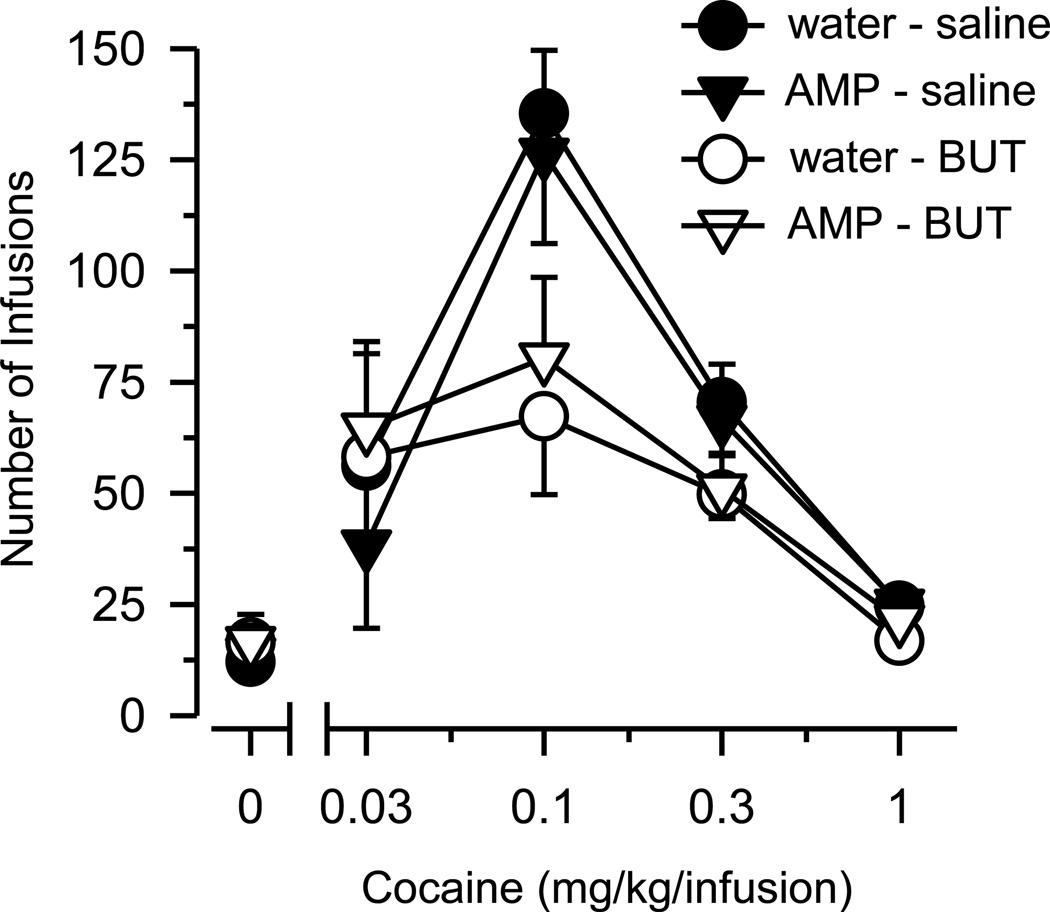
Figure 2.
Cocaine self-administration on a fixed ratio (FR1) schedule of reinforcement. Vertical axis depicts number of infusions obtained during 2-hr test session. Horizontal axis depicts dose of cocaine in mg/kg/infusion. Data points above “0” depict the effects of saline. Vertical lines surrounding data points depict the SEM; where not indicated, the SEM fell within the data point.

