
Fig. 6.
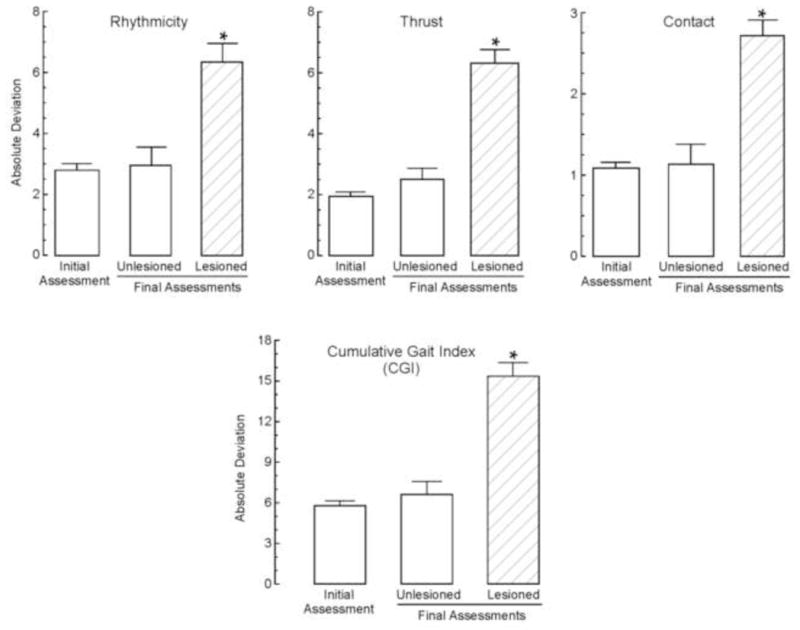
Resultant PCA factors and the cumulative gait index. The 3 factors generated by the PCA (Rhythmicity, Thrust and Contact) and the CGI were analyzed across timepoints. Bars represent mean values + s.e.m. with an n=56 for initial assessments representing the total population, n=11 for the unlesioned group and n=45 for the lesioned group. Data were compared using a one-way ANOVA. The asterisks denote significant (p<0.05) differences from all other groups as determined by Tukey’s test.