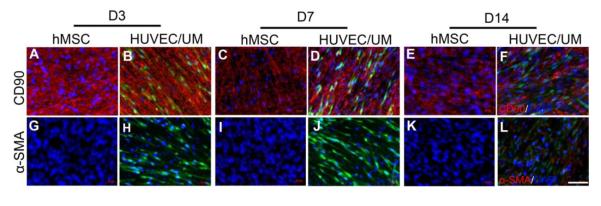
Fig. 4.

Immunofluorescent staining images of hMSCs sheet with CD90 on day 3, 7, and 14 (A,C,E), and hMSCs sheet with HUVECs seeded (B,D,F). Fluorescent image of α-SMA when hMSCs sheet was continuously cultured for 3, 7, and 14 days (G,I,K), and when HUVECs were cultured on the hMSCs sheet (H,J,L). Red: CD90 and α-SMA; Blue: DAPI. Green: HUVEC. Scale bar= 100 μm.
