Fig. 7.
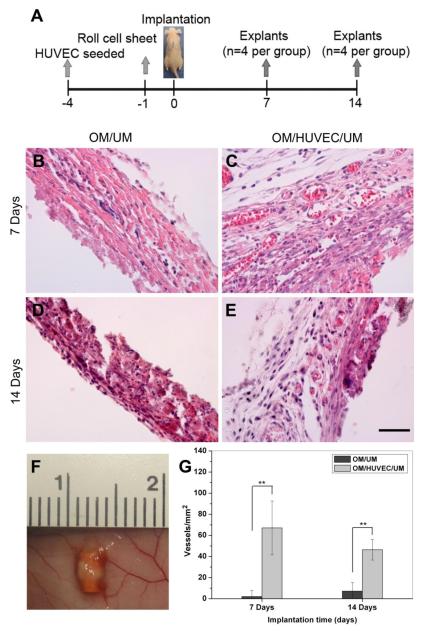
H&E staining of removed implants in vivo. Schematic figure shows the timeline of implantation: the constructs with HUVECs named OM/HUVEC/UM as experiment group, and a same rolled cell sheet constructs without HUVECs named OM/UM as a control. The implants were retrieved after 7 and 14 days in vivo (A). Representative images of H&E-stained sections from OM/HUVEC/UM and OM/UM implants, revealing the presence of numerous blood vessels containing murine erythrocytes (B-E). The overall view of a representative implant under skin is shown in (F). The extent of the vascular-network formation was quantified by measuring the microvessel density (G). The data are presented as mean ± SD. Significant difference between the OM/HUVEC/UM and OM/UM are shown as ** (**p<0.01, n=8) (Scale bar= 50 μm).

