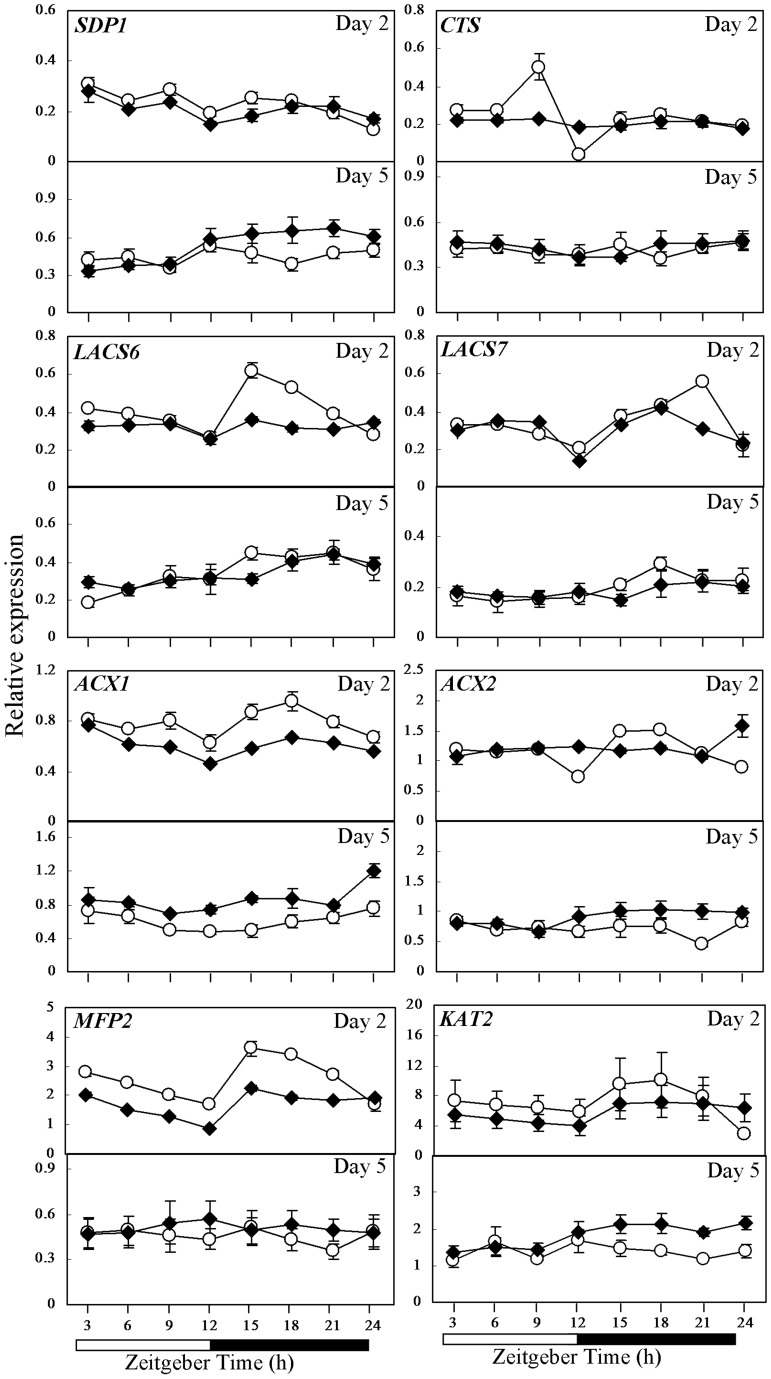
Figure 4. Comparison of gene expression of lipid metabolism between CCA1-OX and wild-type Col-0 as investigated by qRT-PCR.
Expression of CTS, SDP1, LACS6, LACS7, ACX1, ACX2, MFP2 and KAT2 in 2- and 5-day-old seedlings of wild-type Col-0 (open circle) and CCA1-OX (closed rhombus) germinated under 12-h-light/12-h-dark cycles. Relative gene expression level on the Y axis was normalized against IPP2. Each time point represents a mean value of six repeats from two independent biological samples ± SE. White boxes, subjective day; black boxes, subjective night.

