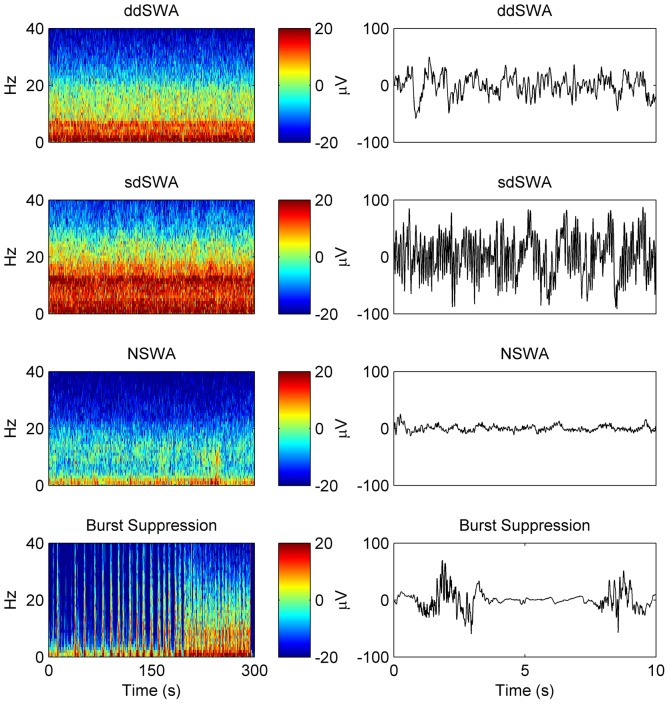
Figure 1. Spectral patterns at the end of maintenance under sevoflurane general anesthesia comprise 4 basic patterns.
‘Slow-Wave Anesthesia’ (SWA) is a spectral pattern in which there is both high delta and spindle power (>7 dB). Panel (A) shows the more common variant, or subclass, of the SWA spectrogram, calculated over 5 minutes prior to turning off the anesthetic, in which delta power is higher than spindle power (point #1 below the diagonal in Figure 2B) termed delta dominant SWA, or ddSWA. An example 10 second raw EEG tracing is take from this period and shown in the right column. Panel (B) is an SWA spectral variant/subclass in which spindle power is higher than delta power, termed spindle-dominant SWA, or sdSWA (point #2 above the diagonal in Figure 2B). Finally, a small subset of patients (5%) showed low amplitude power in both the spindle and delta frequency bands (C). We termed this pattern non Slow-Wave Anesthesia, or NSWA (point #3 in Figure 2B). For completeness, the spectrogram in panel (D) reflects a deeper anesthetic maintenance pattern, burst suppression, transitioning into a ddSWA pattern at approximately 1.5 minutes prior to End Maintenance. The representative 10 second EEG to its right is taken from the burst suppression period.

