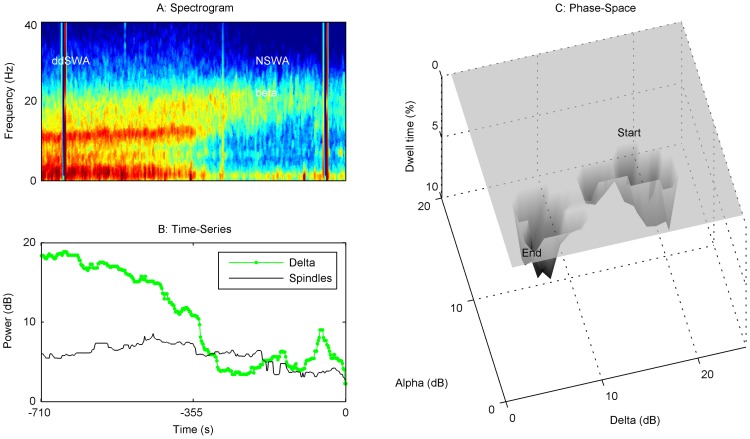
Figure 3. Emergence Trajectory 1, SWA → NSWA.
The upper left panel (A) is the spectrogram from Start Emergence (measured in negative seconds) to End Emergence (time 0 seconds) for a representative patient (#81); this also corresponds to the time of anesthetic wash-out from the brain. Below it is a time series (B) that quantifies spindle and delta power (dB) over the same emergence period. To the right is a dwell time state-space plot (C). The evolution of spindle and delta power over the emergence trajectory from Start Emergence (upper right) to End Emergence (lower left) is shown where the depth of the contour (y-axis) reflects the time spent in each pixel of the state, as a percentage of the total emergence time. At the start of emergence, this patient remained for a signficant period in a slow-wave state (SWA) characterized by higher delta to spindle power ratio (ddSWA). There was a relatively abrupt transition period of approximately 60 seconds, to a second attractor characterized by lower delta and spindle power (NSWA) prior to waking-up. In our sample, 23% of patients had a similar trajectory.

