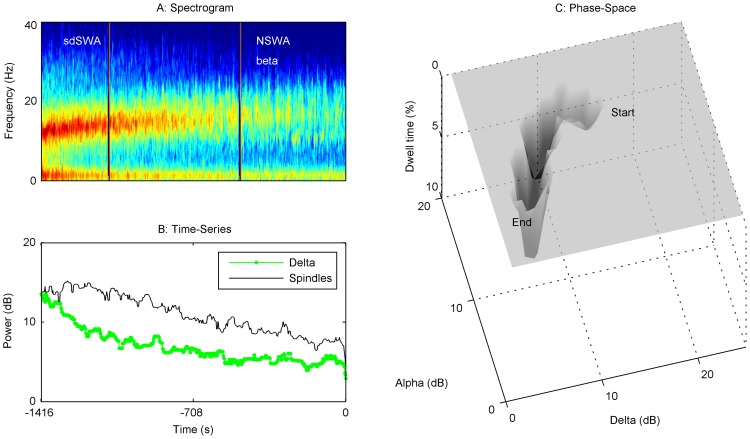
Figure 4. Emergence Trajectory 2, SWA→NSWA, continuous progression.
The spectrogram (A) and time series (B) from Start Emergence to End Emergence for a representative patient (#36) are shown. To the right is dwell time state-space plot (C). This patient started in a slow-wave state (SWA). Over approximately 1.5 minutes, the patient transitioned into a state characterized by higher spindle power (sdSWA), and then showed a progressive decrease in delta and spindle power towards the NSWA region over about 20 minutes before waking. There was a converse increase in beta power as alpha/spindle power was diminished. No single deep attractor in state-space characterizes this patient's emergence path until reaching NSWA prior to wake-up. In our sample, 20% of patients had a similar trajectory.

