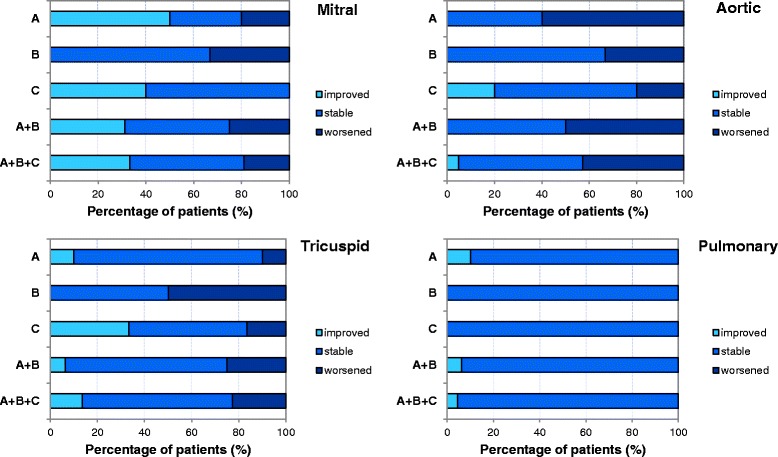
Figure 3.

Post-ERT cardiac valve regurgitation. Percentage of patients of group A, B, C, A + B and A + B + C presenting an improvement, a stabilization or a worsening of regurgitation of the mitral, aortic, tricuspid and pulmonary cardiac valves. Group A: n = 10, group B: n = 6, group C: n = 6 for tricuspid and pulmonary valves, n = 5 for mitral and aortic valves.
