
Figure 4.
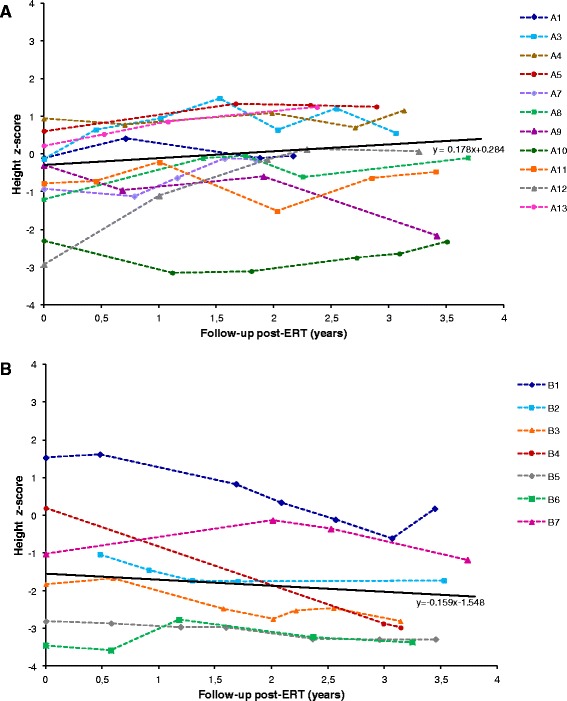
Height z-scores. Regression plot for height z-scores before the start of ERT (time-point = 0) and after the start of ERT (time-points t >0) for patient groups aged ≤5 years (A) and >5 and ≤ 12 years (B).
Official websites use .gov
A
.gov website belongs to an official
government organization in the United States.
Secure .gov websites use HTTPS
A lock (
) or https:// means you've safely
connected to the .gov website. Share sensitive
information only on official, secure websites.
Height z-scores. Regression plot for height z-scores before the start of ERT (time-point = 0) and after the start of ERT (time-points t >0) for patient groups aged ≤5 years (A) and >5 and ≤ 12 years (B).