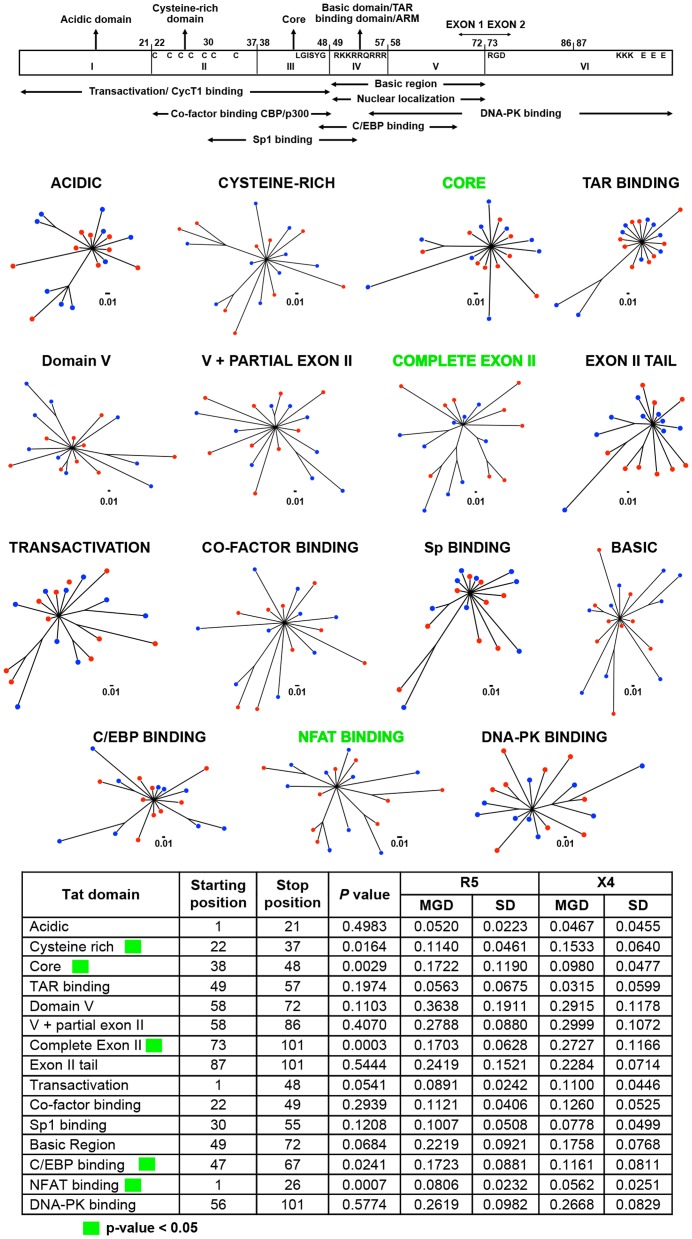
Figure 8. Phylogenetic trees and MGD comparisons of domains of Tat between selected X4 and R5 sequences.
The final nine selected X4 sequences and nine selected R5 sequences were utilized in different Tat domain analyses by phylogenetic construction as well as MGD analysis. The different 15 domains of Tat were selected based on both structural and functional properties. The phylogenetic trees were constructed using the maximum-likelihood method; a simple Python script was also written to automate the process of generating the hundreds of trees. The branch distance was calculated between all pairs of X4 and R5 sequences. These groups of distances were tested for a significant difference using a two-tailed student t-test. The MGD, SD, and P value of each group are shown. The three best P values are shown in green, and the least three significant comparisons in purple.

