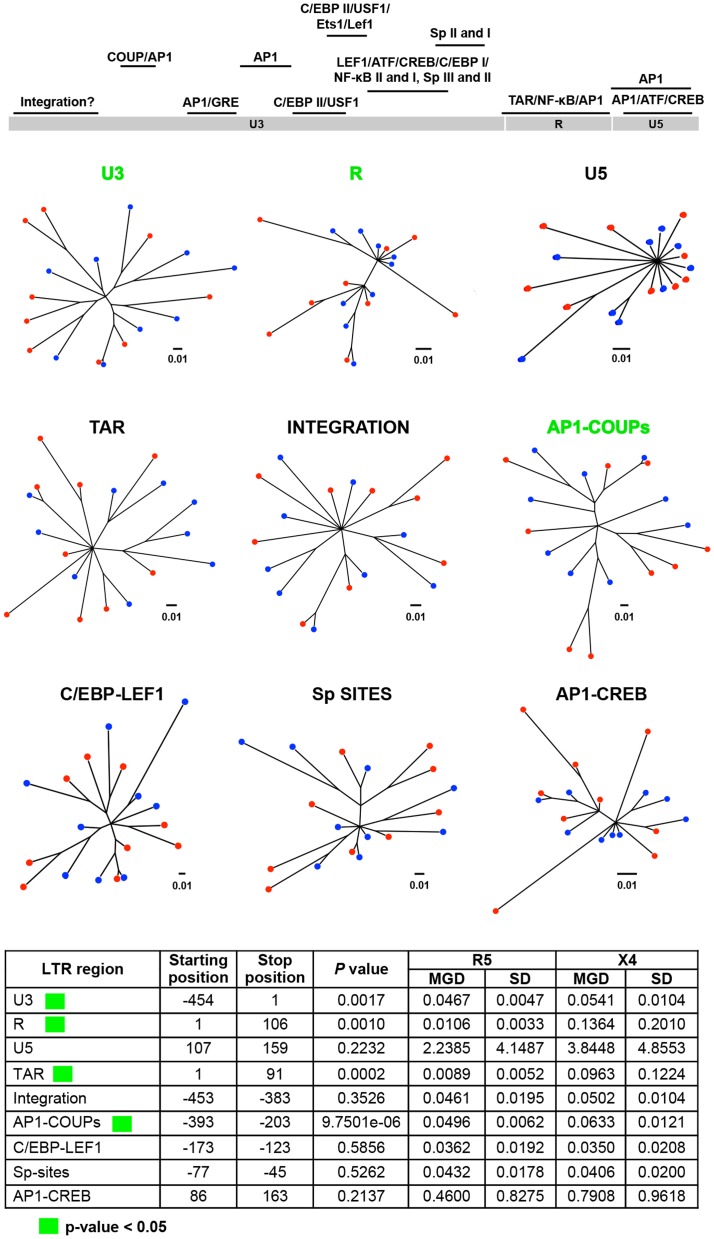
Figure 9. Phylogenetic trees and MGD comparisons of different LTR regions between selected X4 and R5 sequences.
A total of nine regions of LTR were chosen based on the known functions. Utilizing a maximum-likelihood algorithm, phylogenetic trees were created based upon a total of 18 sequences, which included nine sequences of X4 and nine sequences of R5. A simple Python script was generated to automate the process of creating the hundreds of trees; additionally, each branch distance was calculated between all pairs of X4 and R5 sequences. Each group of distances was tested for significant differences using a two-tailed student t-test [115]. The MGD, SD, and P value of each group are shown. The three most significant comparisons are shown in green and the three least significant ones in purple.

