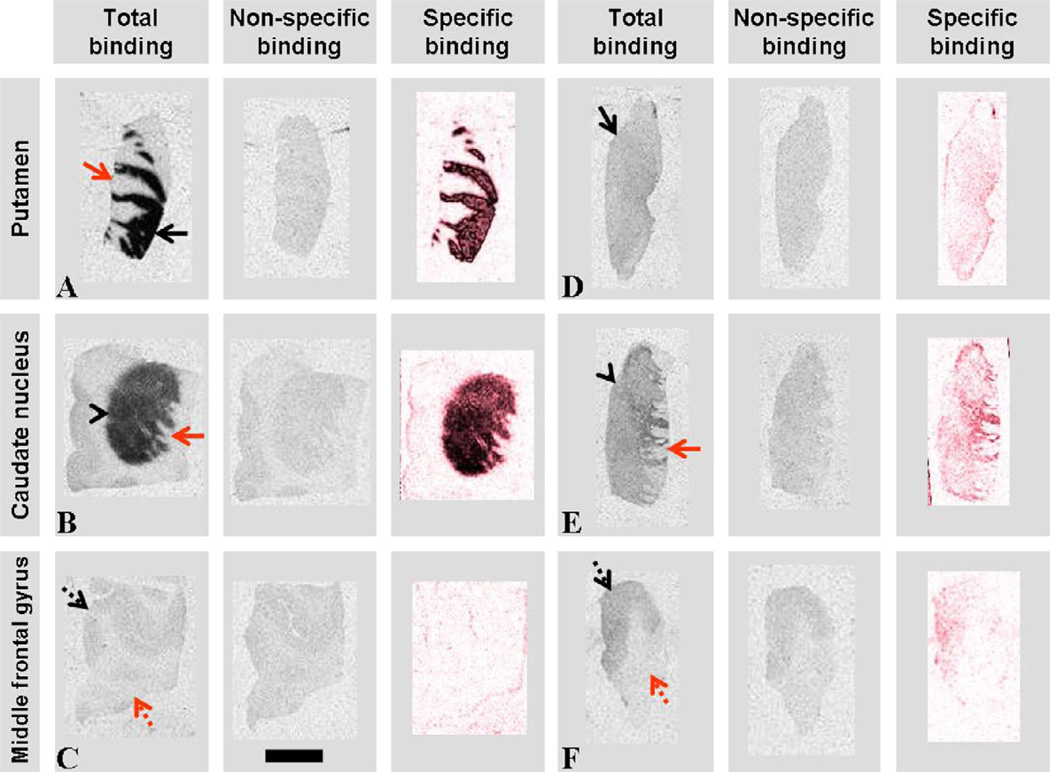
Fig. 2.
Images of D2/D3 receptor autoradiography obtained in control (A–C) and PD (D–F) putamen (black arrow), nucleus caudatus (black arrow head) and medial frontal gyrus sections. Red arrow, internal capsule; dotted black arrow, cortex; dotted red arrow, white matter. Specific binding represents subtracted, red weighted images of total binding −non-specific binding. Scale bar indicates 10 mm.

