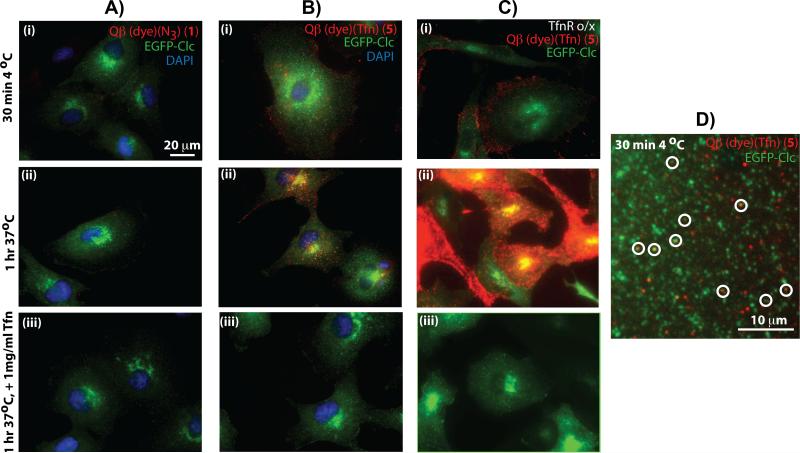
Figure 3.
Representative epi-fluorescence microscopy images showing binding and internalization of VLP particles in EGFP-Clc BSC1 cells. (Column A) Qβ particle 1 with EGFP-Clc BSC1 cells. (Column B) Qβ-Tfn conjugate 5b with EGFP-Clc BSC1 cells. (Column C) 5b and EGFP-Clc BSC1 cells overexpressing transferrin receptors. (Row i) After incubation at 4°C for 30 min. (Row ii) Preincubated at 4°C followed by shift to 37°C for 60 min. (Row iii) As in Row ii, except in the presence of excess free Tfn (1 mg/mL). (D) High-magnification image showing punctate red (5b), green (EGFP-Clc), and colocalized (circled) VLPs with CCPs on the surface of a BSC1 cell after 30 minutes at 4°C. Very similar images were observed with cells incubated at 37°C for 5 min (Supporting Information). In all experiments, VLP concentration was 1.2 μg/mL (0.47 nM in particles).

