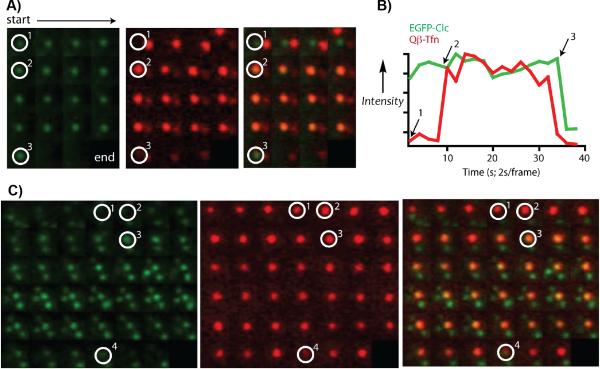
Figure 4.
Live cell TIRF images showing green (EGFP-Clc), red (Qβ-Tfn particle 5b), and merged channels of an approximately 2 μm2 area of the bottom surface of a BSC1 cell. Images go left-to-right across each row, and from top to bottom, taken at 2-second intervals with the green channel preceding the red channel. (A) VLPs associating with a pre-existing coated pit (circled white), followed by internalization of the complex as a whole. Position 1 shows the pre-existing coated pit. Position 2 marks the initial recruitment of the VLP. Position 3 is the time point at which internalization occurs between the acquisition of the green and red channels; note that both are gone at the next time point. (B) Plot of intensity profiles of the CCP (green) and VLP (red) at the indicated spot in (A), normalized each to their respective maximum intensity. (C) VLP nucleating a CCP. Position 1 shows a bound VLP but no clathrin signal. At positions marked 2, the CCP is beginning to assemble at the VLP. By position 3, the pit is fully formed, and it is internalized at position 4. In this case the internalized VLP remains close to the plasma membrane, while the clathrin coat disassembles.

