
Extended Data Figure 8. NCOA4 mediates autophagic delivery of ferritin to lysosomes.
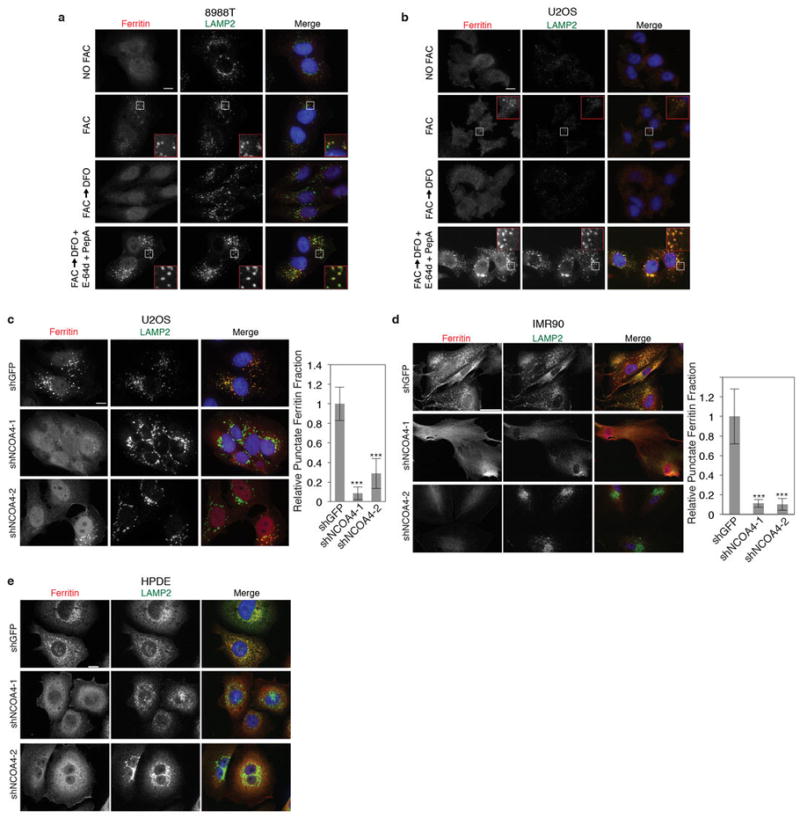
a, 8988T cells were cultured in the presence or absence of FAC for 24 hours, washed, and subjected to DFO chelation -/+ lysosomal protease inhibitors (E-64d and PepstatinA). Cells were fixed and immunostained using antibodies to ferritin (red) and LAMP2 (green). Higher magnification views of the boxed areas are shown in the insets. Scale bar, 10 μm. b, U2OS cells treated and analyzed as in panel a. c, Immunostaining of U2OS cells expressing a control shRNA (shGFP) and two independent shRNAs to NCOA4 (shNCOA4-1 and shNCOA4-2) subjected to DFO chelation in the presence of lysosomal protease inhibitors for 9 hours. Scale bar, 10 μm. Punctate ferritin fraction was quantified from >75 cells per cell line from 2 independent experiments (number of U2OS cells quantitated is as follows: shGFP: 133 cells, shNCOA4-1: 103 cells, shNCOA4-2: 79 cells). Bars and error bars represent mean values and s.d., respectively: ***denotes p<0.001 using a one-sided t-test. d, IMR90 cells as in panel c were treated and immunostained as in panel c. Scale bar, 50 μm. Punctate ferritin fraction was quantified from >25 cells per cell line in two independent experiments and from more than 10 microscopy fields (number of IMR90 cells quantified is as follows: shGFP: 29 cells, shNCOA4-1: 26 cells, shNCOA4-2: 31 cells). Bars and error bars represent mean values and s.d., respectively: ***denotes p<0.001 using a one-sided t-test. e, HPDE cells as in panel c were treated and immunostained as in panel c. Scale bar, 10 μm. Quantitation was not possible due to the high background signal in shGFP control cells.