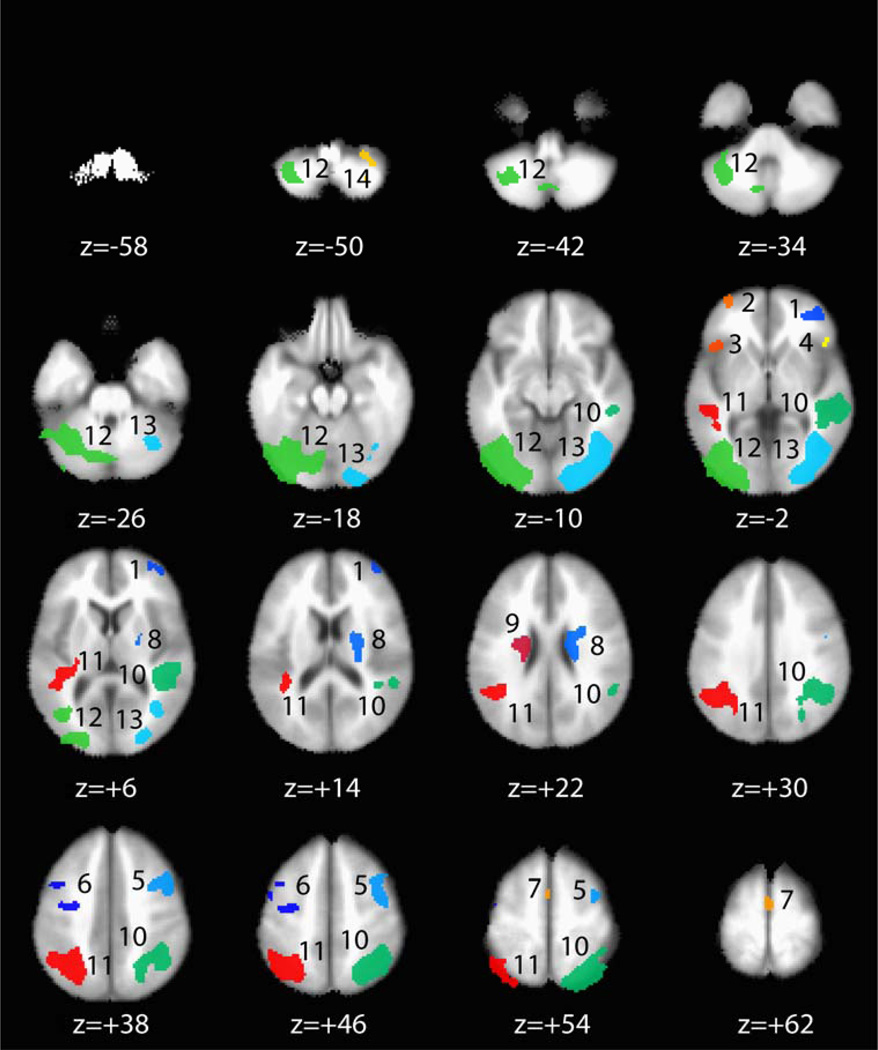
Figure 2. Brain Regions Activated During Correct “No-Go” Trials.
Colored areas indicate brain regions (fROIs) demonstrating significantly greater BOLD % signal change during correct “No-Go” trials than at baseline (voxelwise α = 1.0 × 10⁻⁵; minimum cluster volume threshold = 200 µl; < 0.1 % chance that any fROI identified through this method is a false positive). Each distinct fROI that was identified through this method was assigned a separate color and number. Regions are numbered as in Table 2 and Figure 3. Axial slices display the functional data in stereotaxic space (Talaraich & Tourneaux, 1988) moving from inferior to superior in 8 mm increments to show subcortical as well as cortical activity patterns associated with correct “No-Go” trials. Distance from the anterior commissure in mm (z) is depicted below each slice. Functional data is overlayed on a group-averaged T1 image to reflect inter-individual variability in brain anatomy.

