Figure 6.

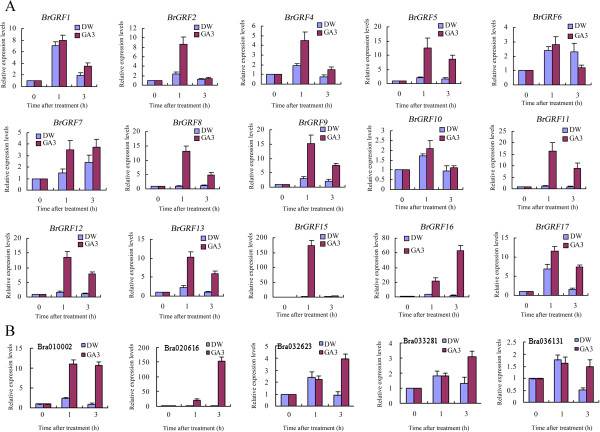
Gene expression of the BrGRF s (A) and BrGIFs (B) in response to GA3 treatment. GA3, 100 μM gibberellic acid treatment; DW, distilled water treatment as the control. The analysis was carried out by RT-qPCR.

Gene expression of the BrGRF s (A) and BrGIFs (B) in response to GA3 treatment. GA3, 100 μM gibberellic acid treatment; DW, distilled water treatment as the control. The analysis was carried out by RT-qPCR.