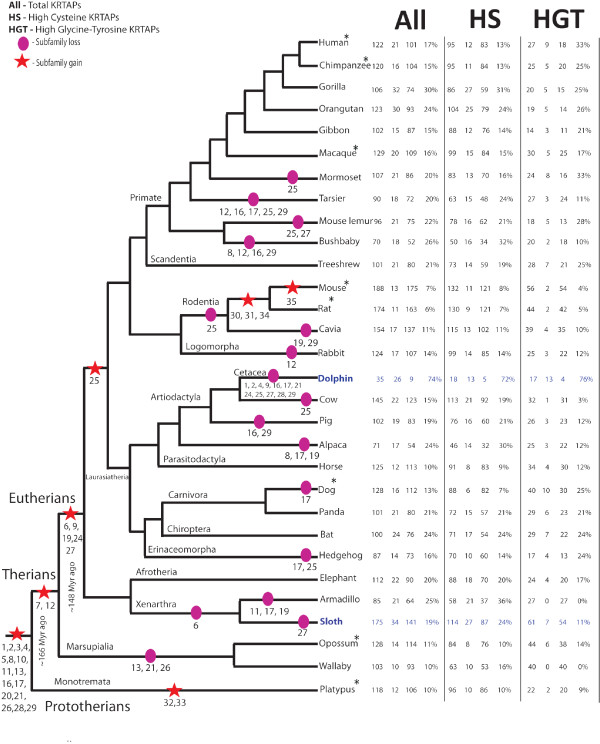
Figure 3.

The topological tree representing evolution of KRTAP gene family repertoires in 30 mammalian species. Twenty-two from the present study and eight from Wu et al, 2008 [14] marked with an asterisk). Stars and circles respectively show the gain and loss of subfamilies, by numbers below.
