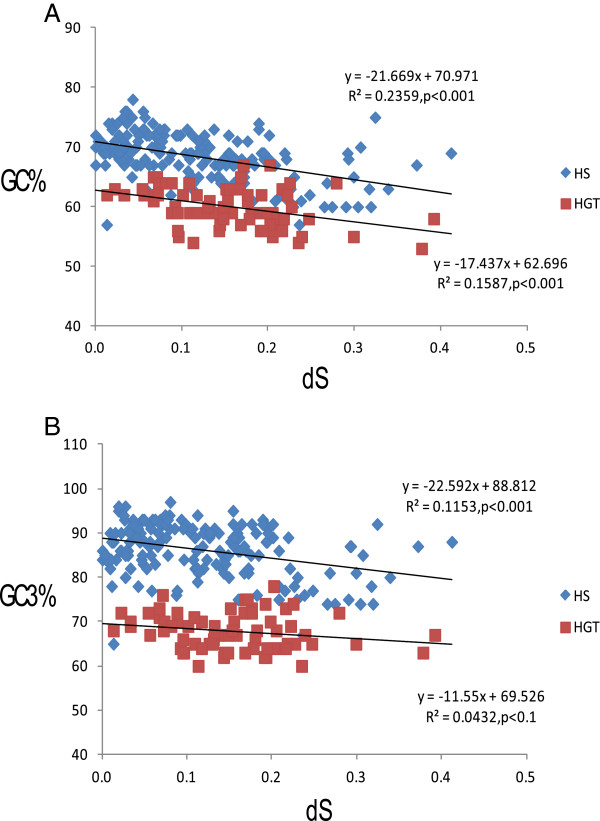
Figure 6.

GC-content dynamics. Figure legend text GC-biased gene conversion (gBGC) and evolutionary distance between the KRTAP genes, shown by the correlation between the synonymous substitution rates (dS) and GC content (GC%) among paralogous members of each subfamily (A) and third codon GC content (GC3%) (B). Negative correlation points towards the gene conversion. High cyteine KRTAP (HS) and high glycine-tyrosine KRTAP (HGT) are represented by blue and red squares respectively. The linear regression is shown.
