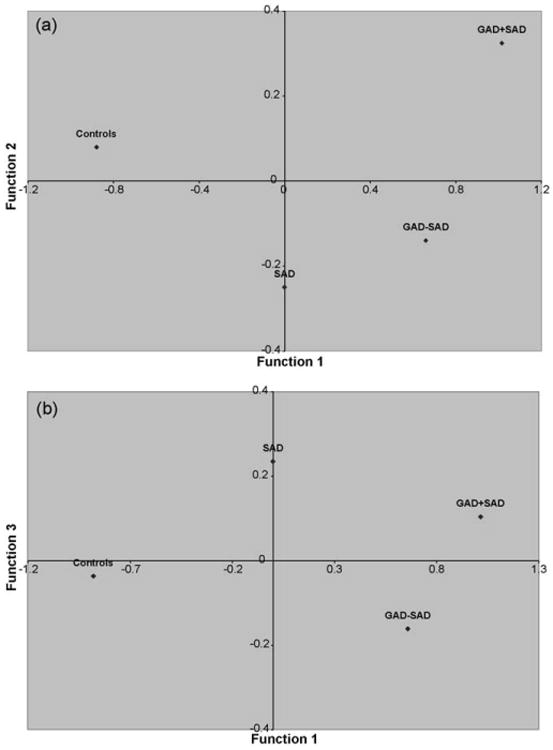
Fig. 1.

The mean scores of the two unstandardized canonical discriminant functions for the GAD groups with and without SAD, the SAD only group, and normal control group plotted in discriminant spaces of (a) Function 1 (vertical axis) × Function 2 (horizontal axis) and (b) Function 1 (vertical axis) × Function 3 (horizontal axis).
