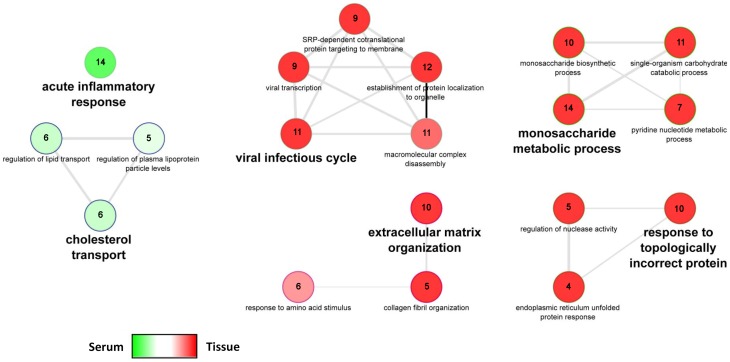
Figure 4. Protein set enrichment analysis using the Cytoscape plugin ’ClueGO’.
In the network, only significantly enriched categories (p-value<0.05, Bonferroni corrected) are shown. The node color represents the commonality of members of either the differentially expressed serum or tumor proteome list. Dark red highlights categories that are specific to the tissue proteome signature while dark green represents biological processes that are specific to the serum proteome signature. The number of proteins associated with each GO category are indicated within the corresponding node. The edges of the resulting ClueGO network are based on kappa statistics and reflect the relationships between the GO terms (network nodes) based on the similarity of their associated proteins. The complete results and relevant statistics are summarized in Table S2.

