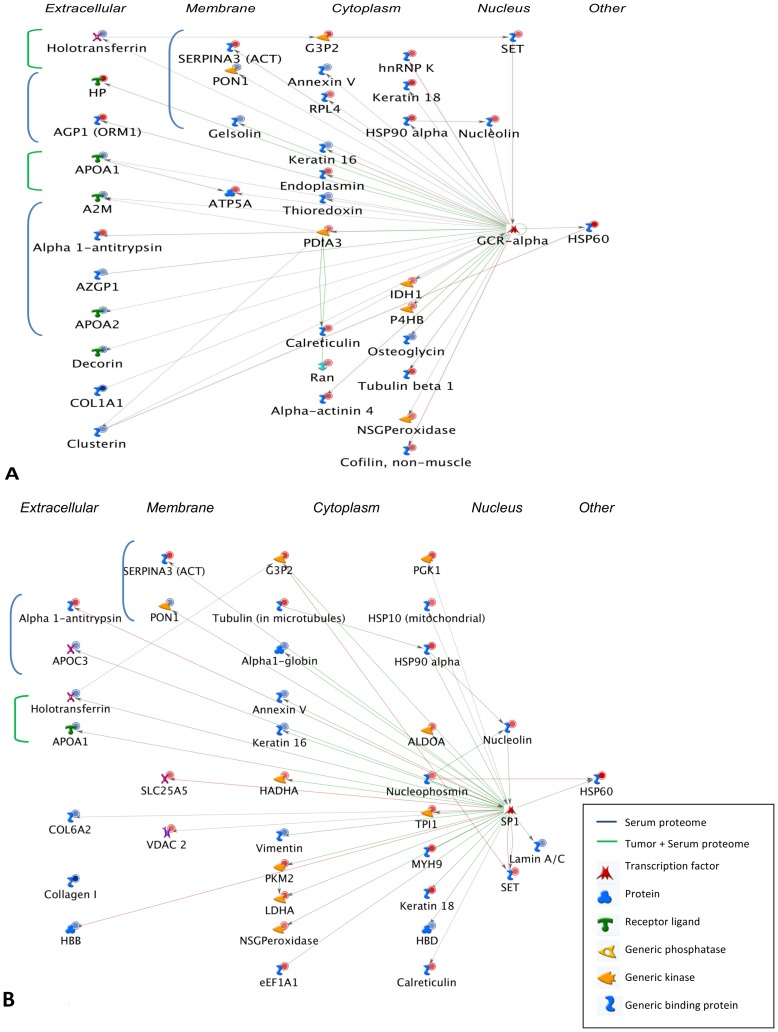
Figure 5. Proteins in the serum and tumor datasets that are potentially associated with GCR-alpha (A) and SP1 (B) pathways.
The proteins marked in blue were found in the serum dataset, those marked in green in both tumor and serum. Unmarked proteins are specific for the tumor signature (except GCR-alpha and SP1). Proteins are ordered according to their position within the cell (extracellular, membrane bound, cytoplasmic or nucleic). Individual proteins are represented as nodes, the different shapes of the nodes represent the functional class of the proteins. The arrowheads indicate the direction of the interaction, the color of the lines between nodes describes activation (green), inhibition (red), and unspecified (black) interactions. The small circles on top of the protein symbols indicate up-regulation (red) or down-regulation (blue).

