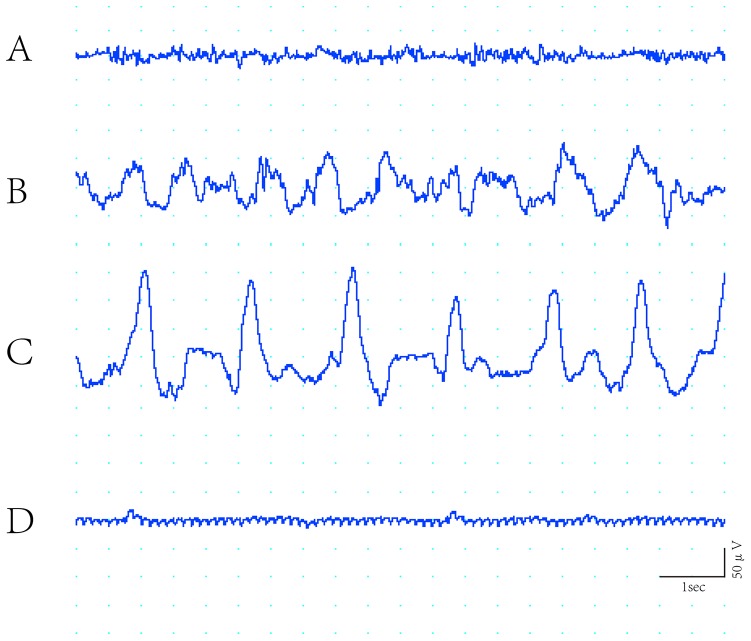
Figure 1. Typical changes in EEG during insulin-induced severe hypoglycemia.
A. Normal EEG. B. EEG recorded 1.5 h after insulin injection showing a decrease to θ and δ with increasing amplitude. C. EEG recorded 2 h after insulin injection, bursts of δ with total suppression, the harbinger of the iso-EEG. D. Isoelectric EEG with some artifact.

